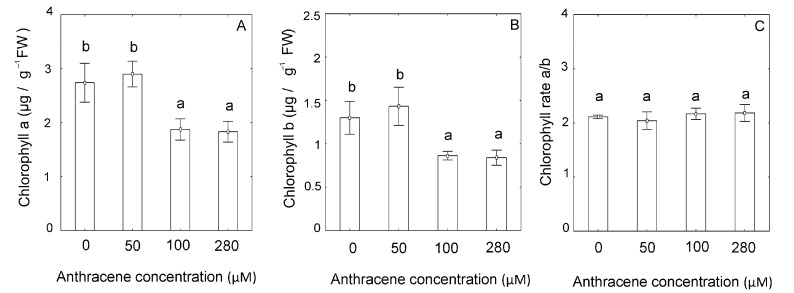
Figure 2.
Chlorophyll a content (A); chlorophyll b content (B); Chlorophyll a/b ratio (C) of M. polymorpha in the presence of the anthracene (0, 50, 100, 280 µM). The data represent the mean ± SE (standard error, n = 3). Values with the same letter are not significantly different between treatments (p ≤ 0.05), as determined by Tukey’s test.

