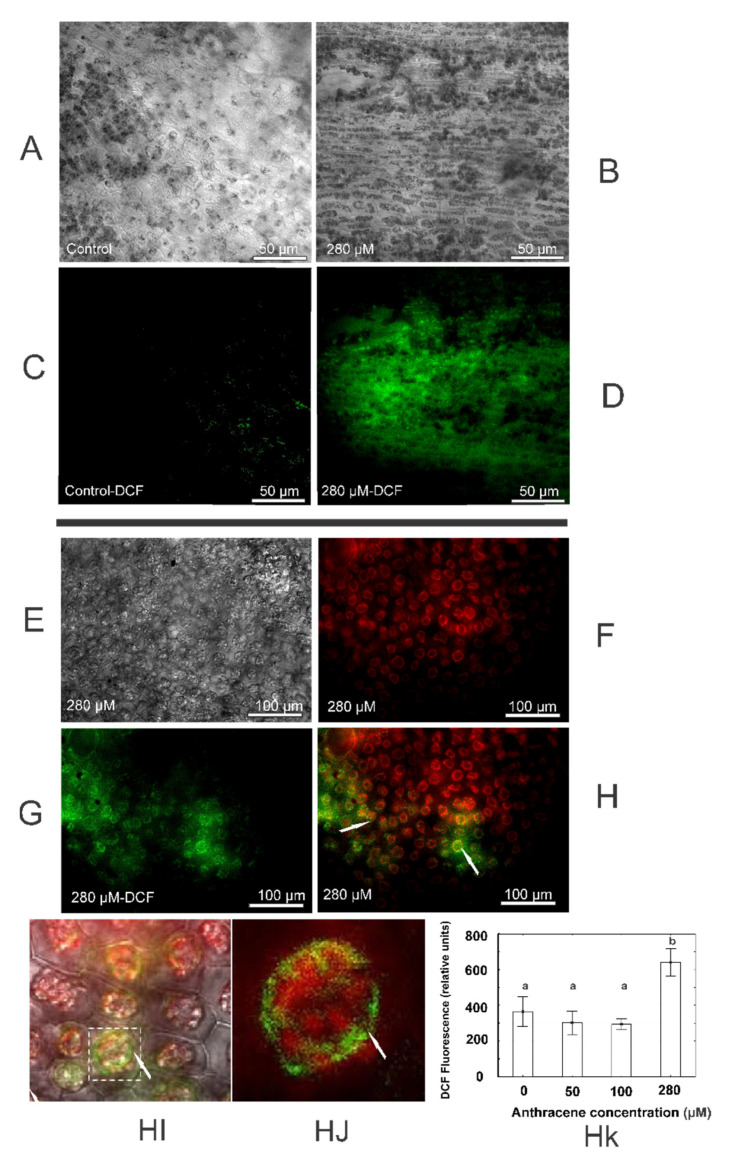
Figure 5.
ROS presence in thallus of M. polymorpha. Thallus of M. polymorpha grown in the absence (A) and presence (B) of 280 µM of anthracene; (C,D) are the same treatments after DCFDA staining. Green signals indicate DCF fluorescence. Thallus of M. polymorpha in presence of 280 µM of anthracene (E), chlorophyll autofluorescence (F), DCFDA fluorescence (G) overlap of autofluorescence and DCFDA fluorescence micrographies (H), green florescence around chloroplast under zoom in H (HI,HJ) and quantitative oxidation measured as relative units of fluorescence (Hk). Red signals indicate chlorophyll fluorescence; green signals indicate DCF fluorescence. The data represent the mean ± SE (standard error, n = 4). Values with the same letter are not significantly different between treatments (p ≤ 0.05), as determined by Tukey’s test.

