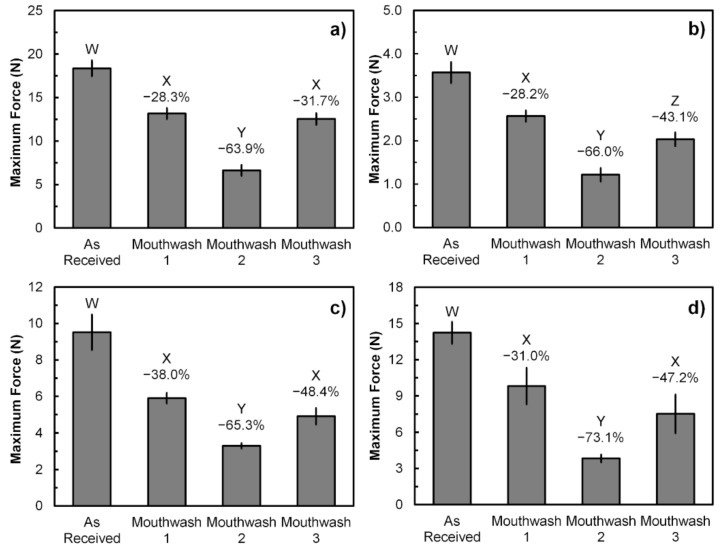
Figure 3.
The maximum force obtained from universal tensile testing of the as-received and mouthwash-rinsed samples: (a) Brand A; (b) Brand B; (c) Brand C; and (d) Brand D. Error bars represent SD (n = 3). Different W, X, Y, and Z letters between the sample groups represent p < 0.05 (One-way ANOVA with Tukey’s HSD pairwise comparison) when compared against each other. Reduction percentages are relative to the As-Received samples.

