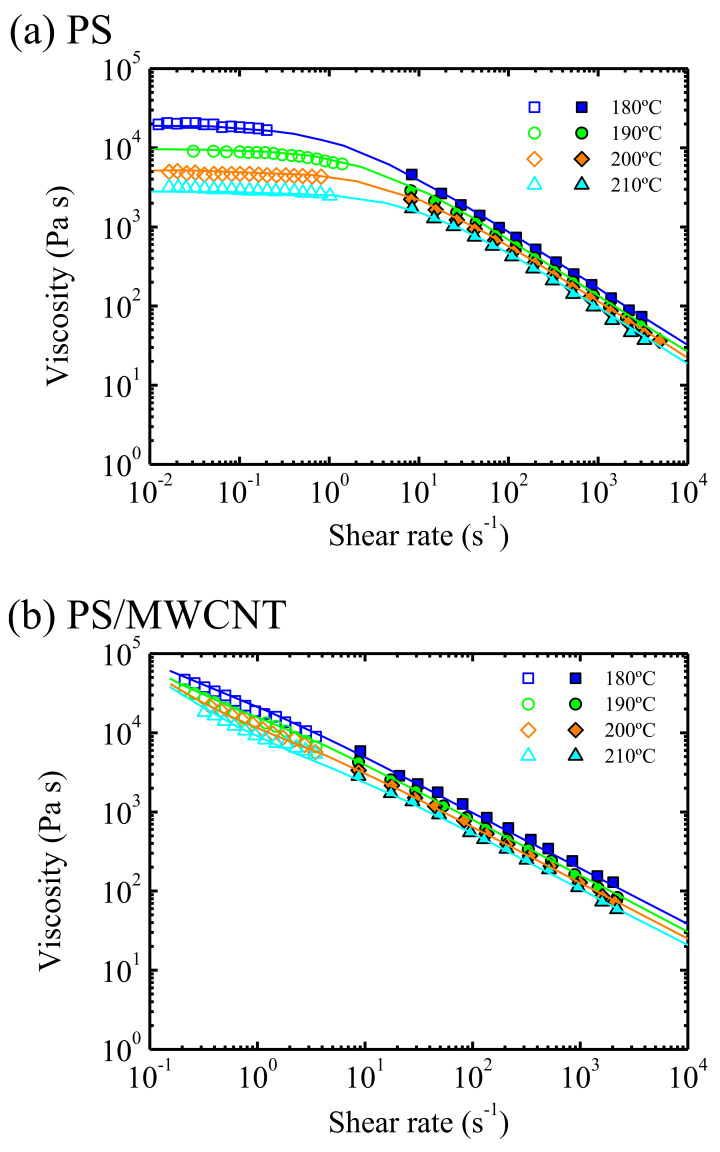
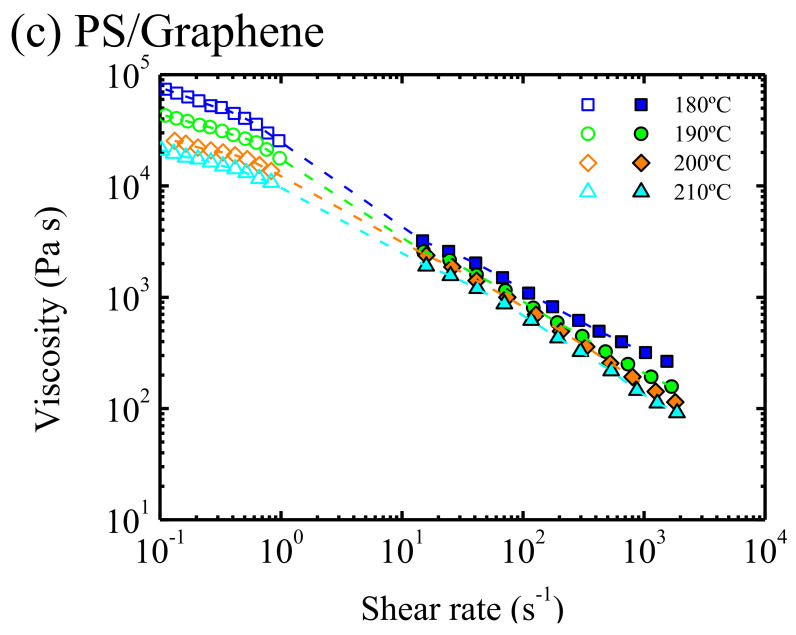
Figure 2.
Viscosity as a function of shear rate for (a) PS, (b) PS/MWCNT, and (c) PS/PS/graphene. Open symbols correspond to data obtained with plate–plate geometry, whereas filled symbols correspond to data obtained by capillary extrusion rheometer [30]. The lines correspond to a modified Carreau Yasuda paper, see reference [30]; for Figure 2c, the discontinuous lines are to guide the eye. Reprinted with permission from [30]. Copyright 2016 The Society of Rheology.


