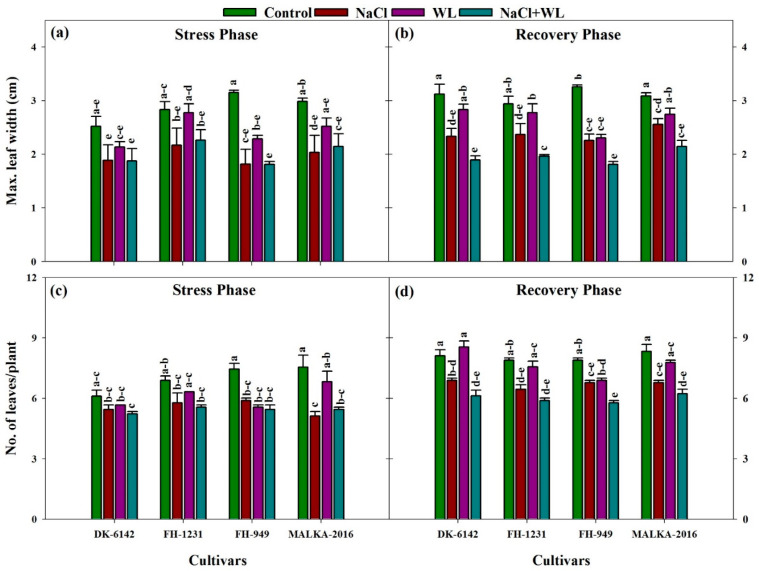
Figure 4.
Individual and interactive effects of salinity and waterlogging on maximum leaf width and number of leaves/plant of four maize cultivars during the stress (22 DAS) and recovery (30 DAS) phases. Left and right sides of the figure are representing stress phase and recovery phase respectively. Error bars denote the standard error of three replications. Bars with same letter do not differ significantly at p ≤ 0.05.

