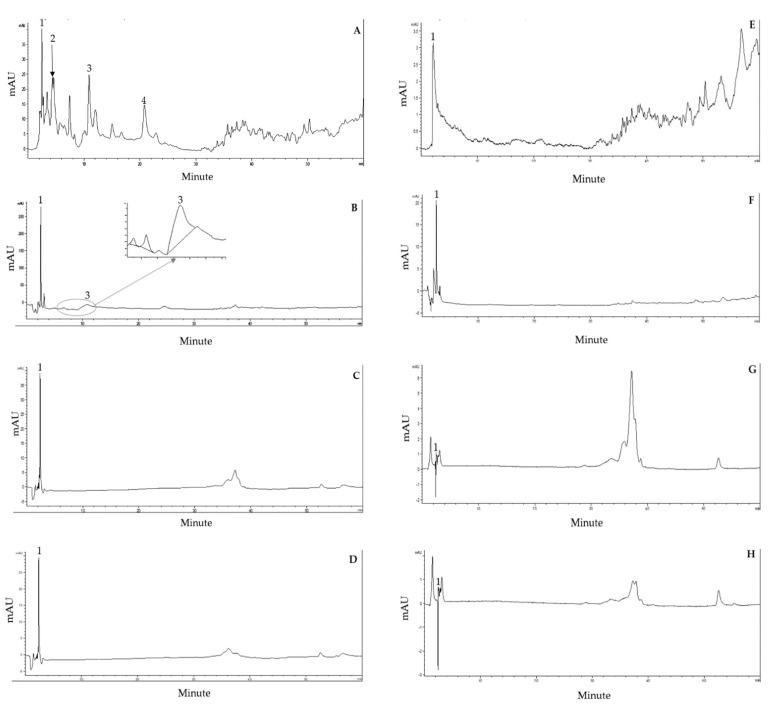
Figure 8.
HPLC chromatograms of phenolic acids showed in the red NAE (A), the white NAE (B), the red NEE (C), and the white NEE (D) from Column, Purospher® Star PR-18; mobile phase, 0.1% formic acid in water and CAN; flow rate, 0.8 mL/min; detection wavelength, 250 nm. Flavonoids presented in the red NAE (E), the white NAE (F), the red NEE (G) and the white NEE (H); detection wavelength, 330 nm. Peak identification: peak 1, quercetin; peak 2, gallic acid; peak 3, catechin; peak 4, p-hydroxybenzoic acid.

