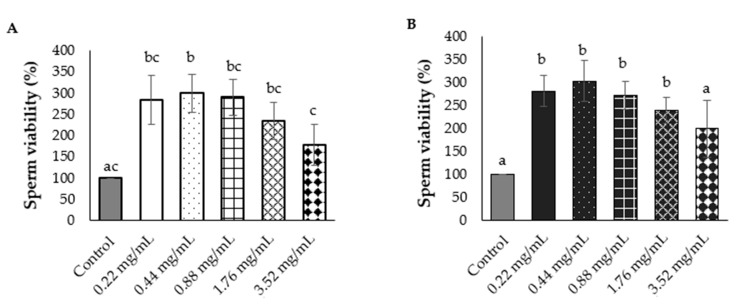
Figure 9.
The percent of sperm viability of the aqueous extract of red N. nucifera petals (A) and white N. nucifera petals (B) compared with the control group. a,b,c The variables with the different letters indicate significant differences between groups at p < 0.05 (One-way ANOVA followed by Tukey’s test). The variables with the same letter are not statistically significant. Data are mean values ± standard deviation (error bars).

