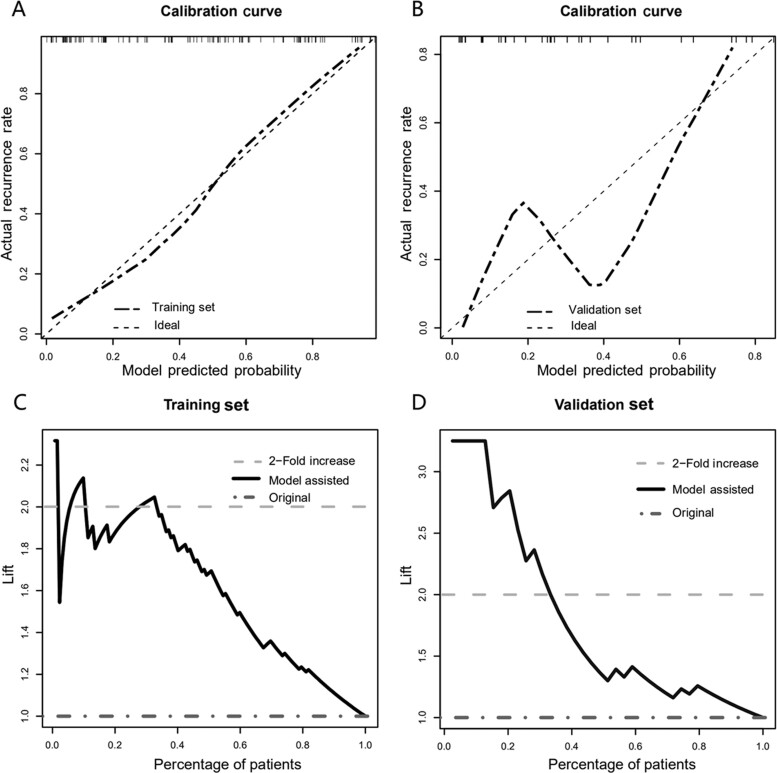
Figure 4.
Calibration for predictive nomogram and its clinical utility. Calibration curves were used to reflect the concordance between nomogram prediction and actual distribution. The 45-degree dashed line represents an ideal prediction. (A) In the training set, it showed excellent calibration. (B) In the validation set, owing to the limited sample pool, there were some wobbles in the calibration curve but it still drifted to the dashed line. Lift curves in training (C) and validation (D) sets. In both sets, a lift value of 2 was achieved in roughly the top 30% of cases. In clinical interpretation, this meant a 2-fold detection rate in the post-operative surveillance in the top 30 high-risk patients with model-aid strategies.

