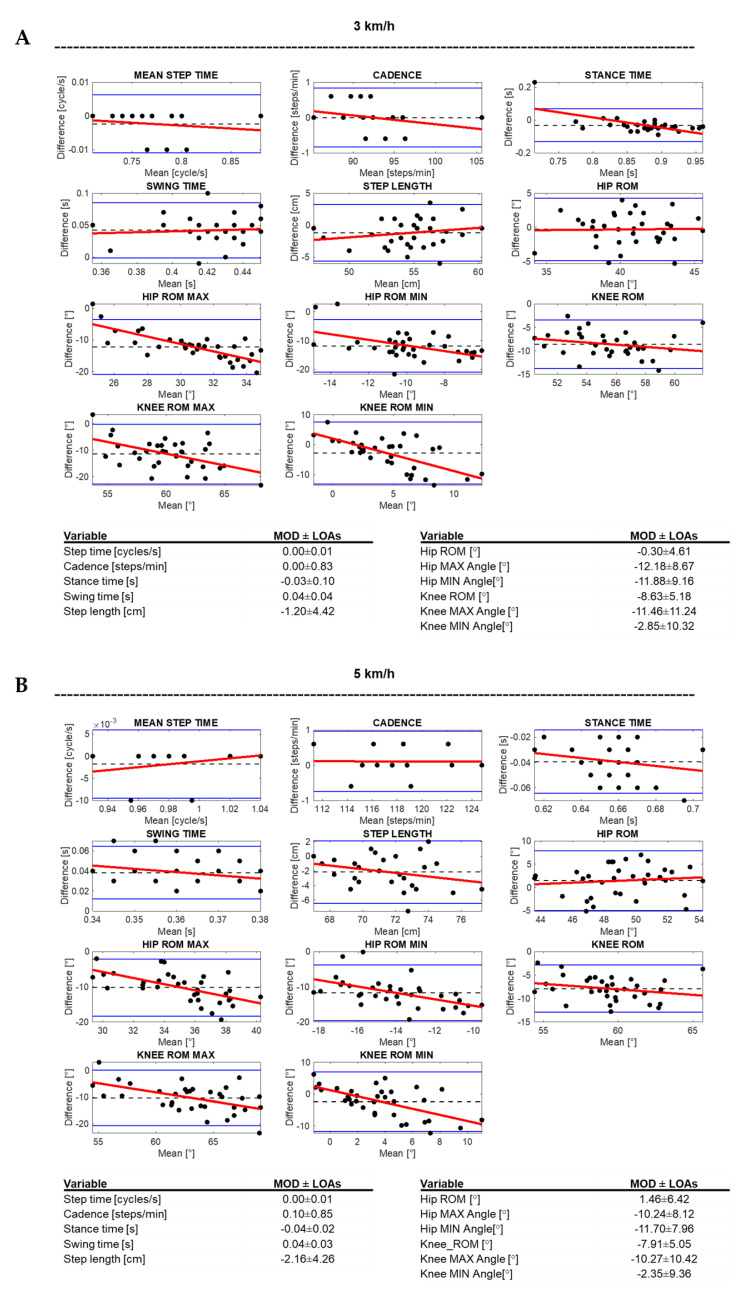
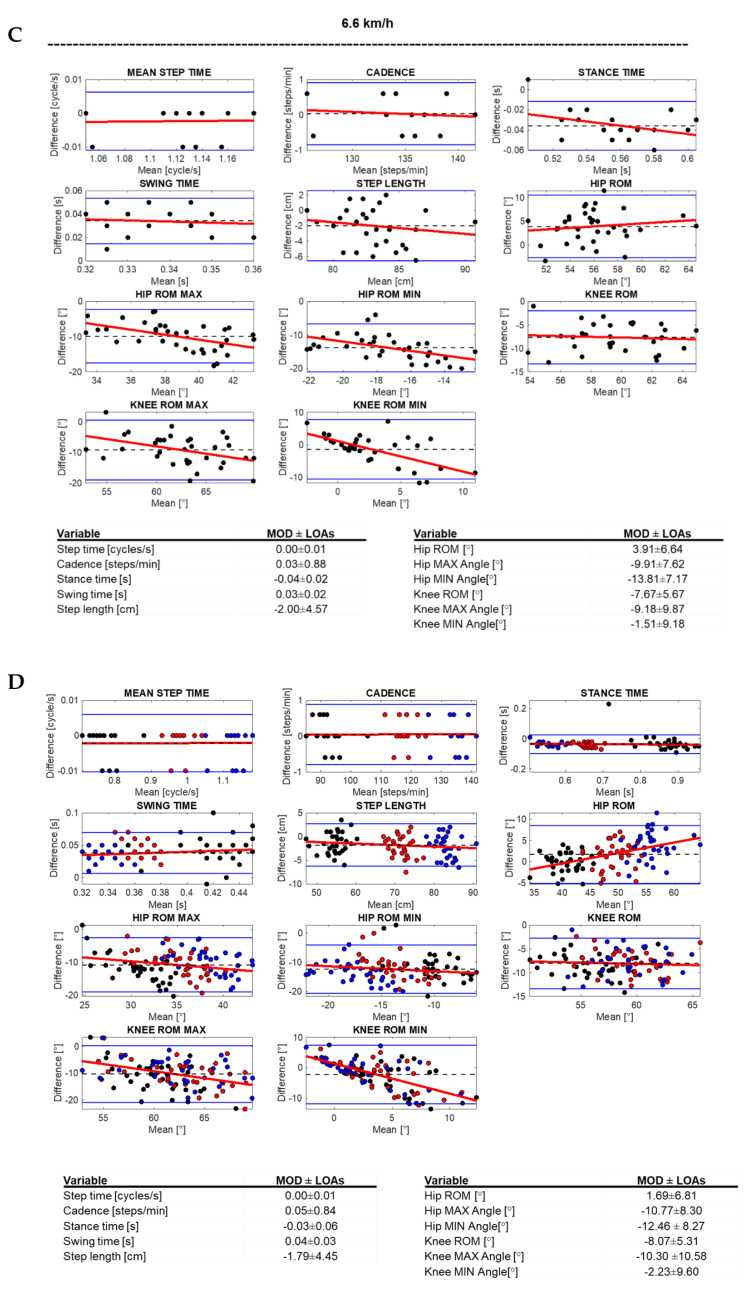
Figure 6.
Bland–Altman plots related to the spatiotemporal and kinematical variables recorded from all the volunteers at 3 km/h (A), 5 km/h (B), and 6.6 km/h (C). In the plots, the black dashed line represents the mean of difference (MOD), blue lines represent the limits of agreement (LOA), and red lines show regression line of the difference on means. (D) Aggregate values of the three walking speeds: black dots for 3 km/h, red dots for 5 km/h, and blue dots for 6.6 km/h. Below, the tables summarizing the MOD and LOA values.


