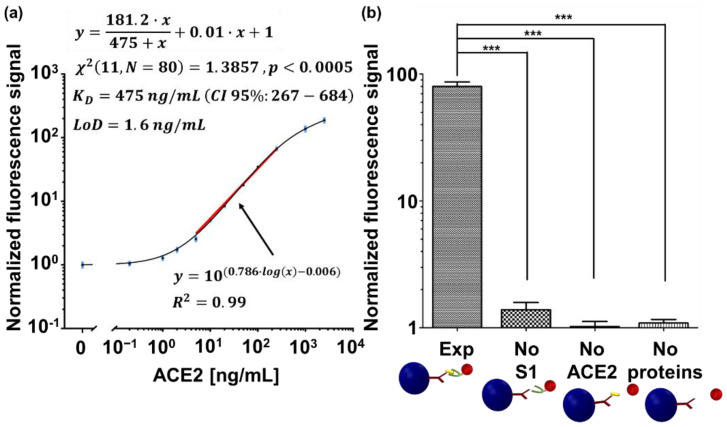
Figure 3.
Detection of the S1-ACE2 interaction. (a) A dose response curve of S1 interaction with ACE2, measured by MMB. All measurements were normalized to the average signal of the conjugated beads. Using all the replicates, the curve was fitted to one site-total binding model. The extracted is reported as (CI 95%: lower limit–upper limit). The chi-square Goodness of fit is reported as (degrees of freedom, sample size). The solid red line was fitted using a non-linear regression analysis to the log-log dose response curve, and it represents the analytical sensitivity of the assay. Error bars (in blue) represent the standard error of the mean (SEM) of blank measurements () and all other concentrations (. (b) Negative controls to the dose response. Abbreviations: “Exp”, conjugated magnetic beads with the attached S1 protein are introduced to 250 ng/mL ACE2 protein and SA-PE. “No S1”, conjugated magnetic beads without the attached S1 protein are introduced to 250 ng/mL ACE2 and SA-PE. “No ACE2”, conjugated magnetic beads with the attached S1 protein are introduced to SA-PE. “No proteins”, conjugated magnetic beads are introduced to SA-PE. Three asterisks (***) indicate a statistical significance of . All measurements were normalized to the signal of the conjugated magnetic beads. The normalized fluorescence signal values are presented as the mean ± SEM.

