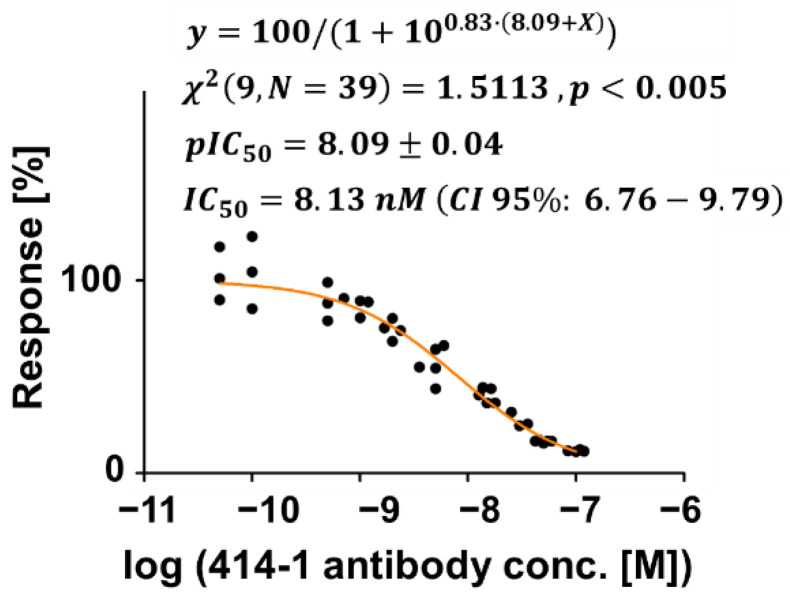
Figure 4.
Assessing an anti-S1 antibody (414-1) as an inhibitor of the S1-ACE2 interaction. Binding curve of the S1-ACE2 interaction with increasing concentrations of the anti-S1 antibody. Measurements were normalized to the average signal (designated as 100% Response) when S1 binds with ACE2, at 0 nM of the anti-S1 antibody. The orange line was fitted using a non-linear regression analysis to the log (inhibitor) versus the normalized response using GraphPad. The chi-square Goodness of fit is reported as (degrees of freedom, sample size). IC50 and pIC50, and their SEM were extracted from the fitted line and are reported as and (CI 95%: lower limit–upper limit). For each concentration .

