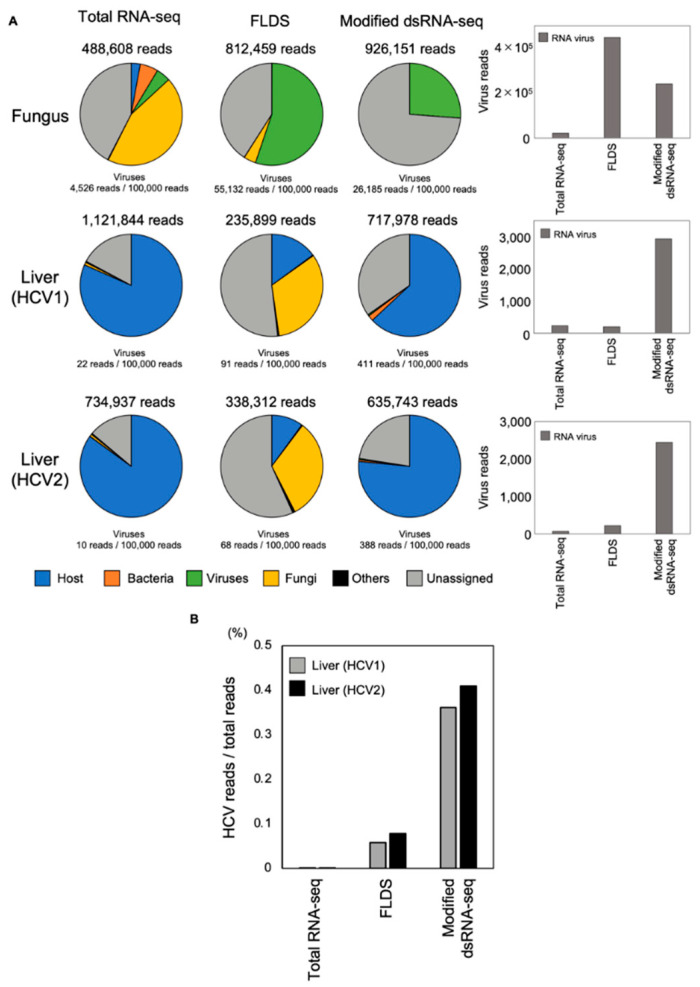
Figure 2.
Evaluation of the utility of the modified dsRNA-seq method. Samples from a fungus and two recipient livers with liver cirrhosis were analyzed by the total RNA-seq, FLDS and modified dsRNA-seq methods. (A) Fungus and liver samples (HCV1 and HCV2) are compared in a pie chart. Blue represents host-derived genome reads, orange Bacteria, green Viruses, yellow Fungi, black Others, and gray Unassigned reads. Virus reads detected by each method are shown in the bar graph at right. Gray represents RNA virus reads. (B) Comparison of the read number of HCV genome detected by each method. The gray bar represents HCV1 in the liver and the black bar represents HCV2 in the Liver.

