Figure 5.
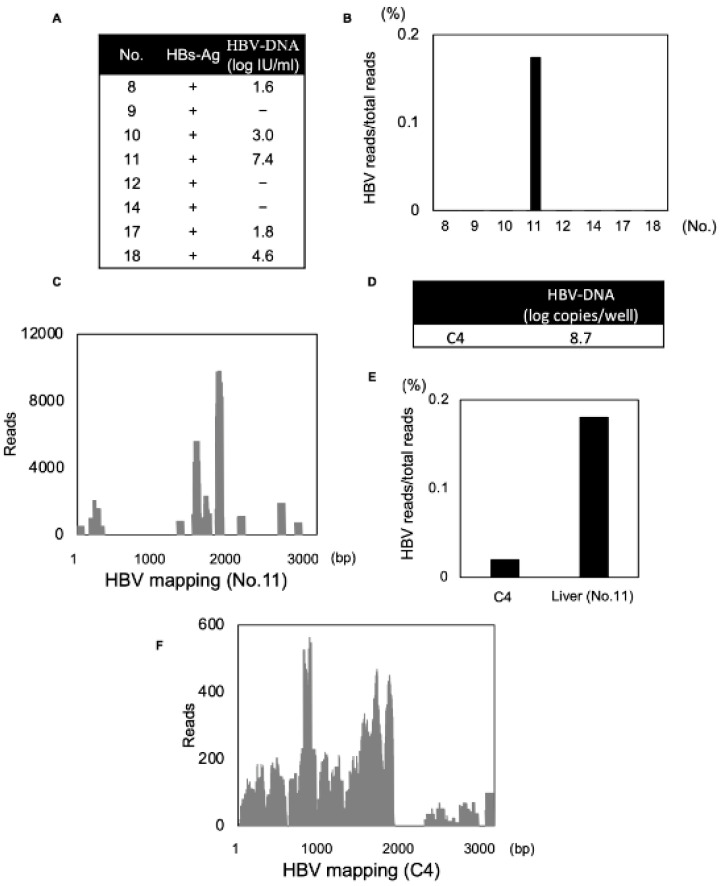
Detection of HBV. (A) Sample list of HBsAg positive recipients. (B) HBV reads compared to total reads obtained from each liver sample are shown in a bar graph. (C) HBV reads identified from a liver sample were mapped to the HBV genome and bar graph was indicated. (D,E) HBV-DNA copies and HBV reads compared to total reads obtained from the lysates of HepG2-hNTCP C4 cells are shown. (F) HBV reads identified from in vitro cell line experiments were mapped to the HBV genome and bar graph was indicated.

