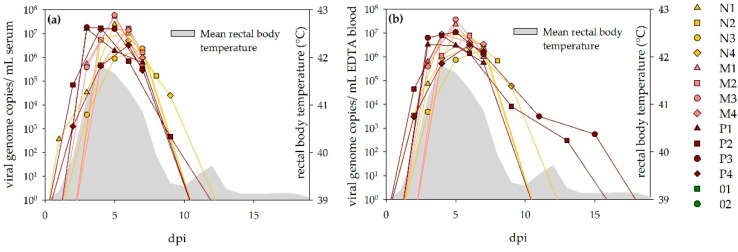
Figure 3.
Viremia detected via RT-qPCR in sheep: Results for serum (a) and EDTA (b) are depicted, respectively. Both curves are comparable between the different dosage groups and sample sources. For two animals (P3, P4), virus was detected in EDTA blood for significantly longer than in the corresponding serum samples. The viremic state coincided well with the fever period (grey pattern).

