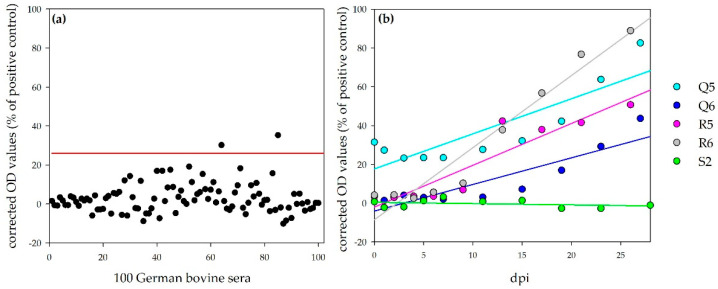
Figure 7.
NSDV ELISA results for bovines: Panel (a) shows the results for 100 German bovine reference sera for the determination of the negative cut-off (illustrated by the red line; specificity, 98%). Panel (b) shows the results for the challenged calves. Whereas the OD values for the control calf (S2) stayed on the same level, linear regressions (calculation performed by Sigmaplot) show a steady increase in OD values for the infected calves.

