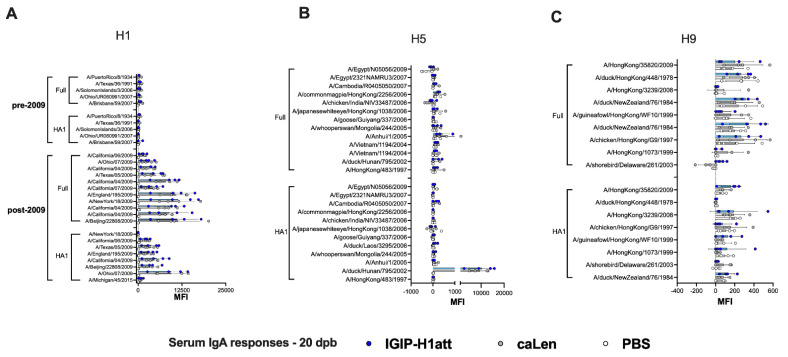
Figure 5.
IgA serum responses 20 dpb in IGIP-H1att- and H1caLen-vaccinated mice. Same set of samples from Figure 4 probed for IgA antibodies against (A) H1, (B) H5 and (C) H9 using the influenza antigen array. The reactivity of serum samples is expressed as described in Figure 4 and results shown as MFI ± SD. IGIP-H1att samples in blue dots/bars. H1caLen samples in grey dots/bars. PBS control samples in white dots/bars. No significant differences were observed.

