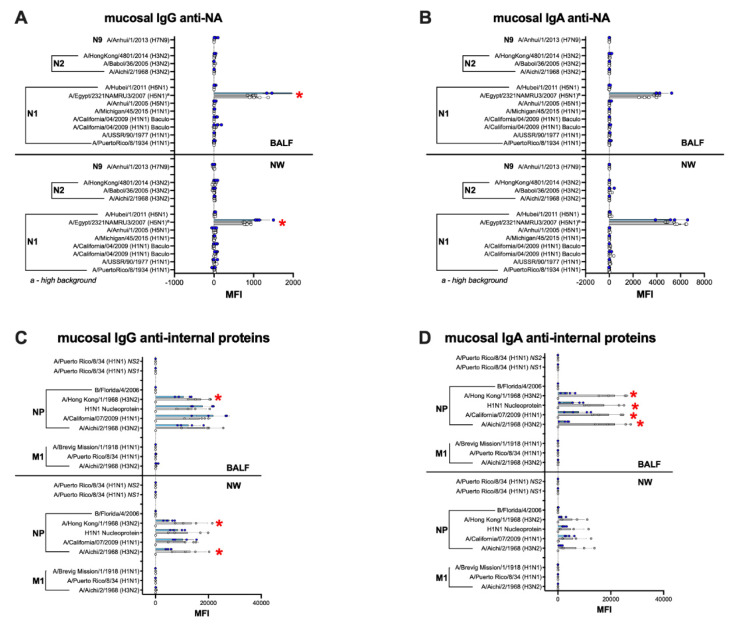
Figure 10.
Mucosal antibody responses against NA and IAV internal proteins. The same set of samples from Figure 8 were probed for anti-NA (A) IgG and (B) IgA antibodies as well as anti-IAV internal protein (C) IgG and (D) IgA antibodies. NW, nasal washes. Insets correspond to combined BALF and NW data in which each dot corresponds to the average reactivity of each sample against anti-IAV internal proteins in the array. (B,C) a Data on N1 NA A/Egypt/2321NAMRU3/2007 (H5N1) antigen was not used for analyses due to high background. The statistically significant differences between IGIP-H1att and caLen are depicted with red asterisks.

