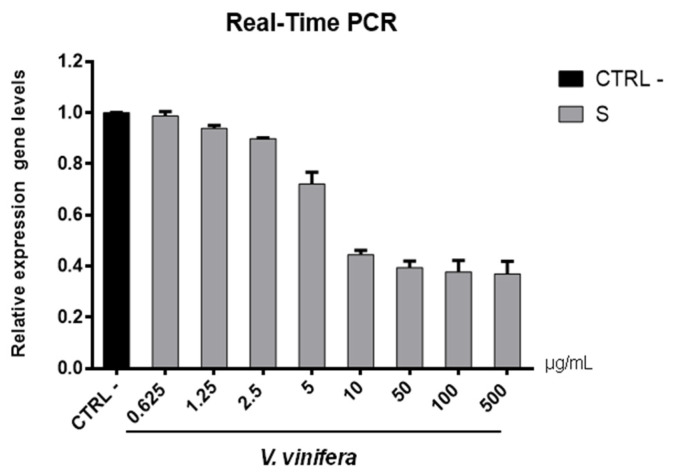
Figure 8.
S gene expression analysis in Vero cells. V.vinifera leaf extract at 0.625, 1.25, 2.5, 5, 10, 50, 100, and 500 μg/mL was incubated with SARS-CoV-2 for 1 h and then the mixture was added on Vero cells for another 1 h. After 2 days post-infection, RNA was extracted, and Real-Time PCR was performed. Relative expression gene levels were calculated with respect to CTRL−.

