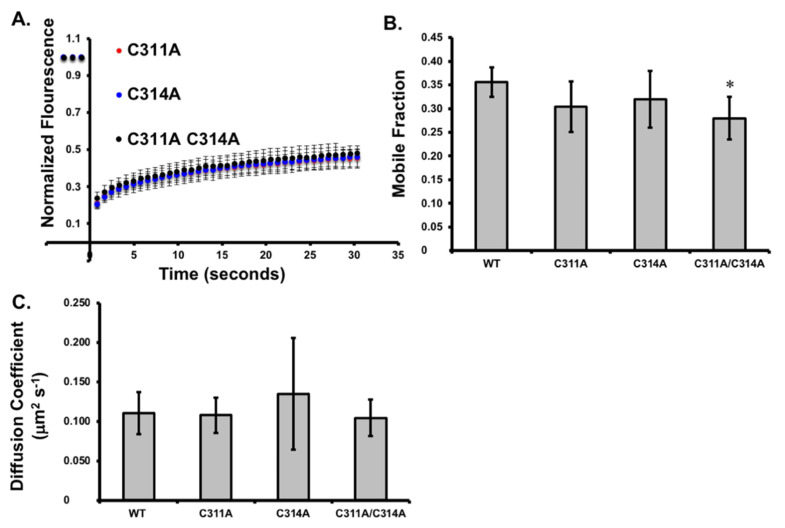
Figure 4.
VP40 dynamics at the plasma membrane. (A) Fluorescence recovery after photobleaching (FRAP) plot of EGFP-VP40-WT and mutants in COS-7 cells. (B) The mobile fraction of EGFP-VP40-WT and mutants in COS-7 cells. (C) The diffusion coefficient of EGFP-VP40-WT and mutants was determined and plotted. Values represent the average value over at least three independent experiments and error bars represent ± standard error of the mean. Significance is marked with a *, determined as a p value of 0.05 or less.

