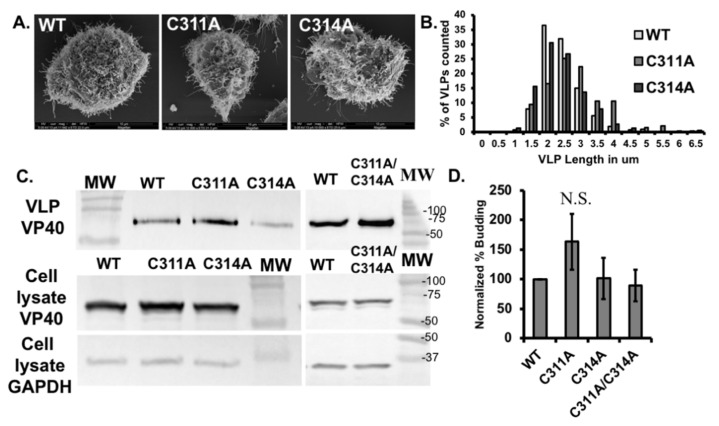
Figure 9.
VLP filament length and budding efficiency assessment for WT-VP40 and cysteine mutations. (A) Representative scanning electron micrographs of EGFP-VP40-WT, and single mutants to show VLPs on the surface of the cell. (B) Histogram of VLP length for EGFP-VP40-WT and single mutants, values are represented as the percentage of the population of VLPs at each length bin for each construct. (C) Western blot of VP40 in the cell lysate and VLP samples. GAPDH was used as the loading control for the cell lysates. (D) Normalized budding efficiency for EGFP-VP40-WT and single Cys mutants. Average values are normalized to WT budding efficiency and represent at least three independent experiments. Error bars are ± standard error of the mean. N.S. = not significant.

