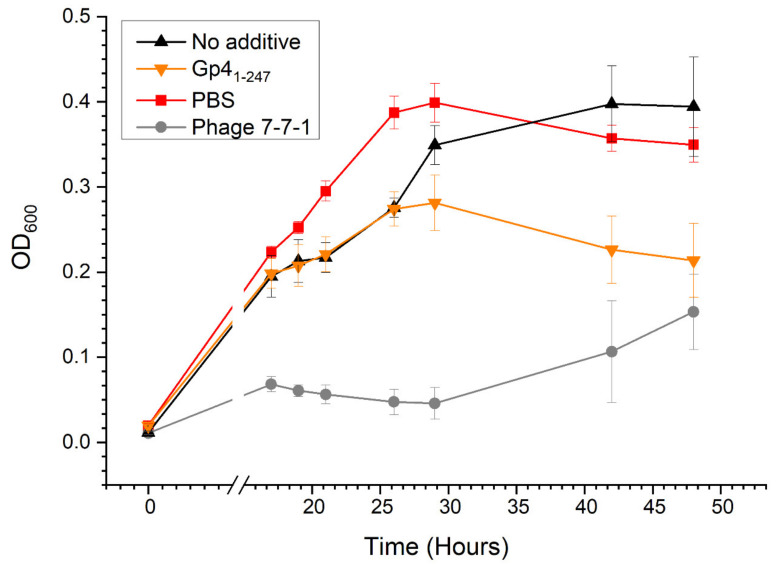
Figure 6.
Growth curves for bacterial cultures under various conditions. Agrobacterium sp. H13-3 (OD600 = 0.03) cells were deposited in 96-well plates and received 2 μL of Gp41-247 (0.06 μg/μL), PBS, phage 7-7-1 (MOI = 1), or no additive. Growth of the cultures was measured via OD600 at 17, 19, 21, 27, 29, 42, and 48 h using a plate reader. Data are representative of 4 independent experiments conducted in quadruplicate and error bars reflective of standard deviation. Student’s t test for Gp41-247 and PBS or phage 7-7-1 at 42 and 48 h, p < 0.005.

