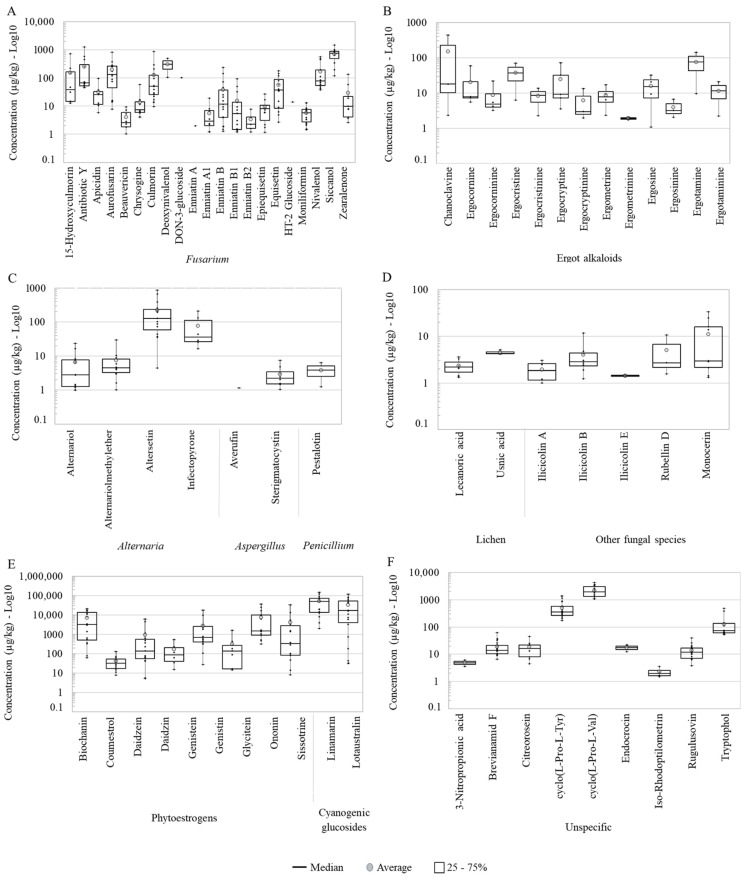
Figure 2.
Boxplots for the log10 concentrations of individual metabolites in each category: (A–D) fungal, (E) plant and (F) unspecific metabolites (produced by fungi, plants and/or bacteria) detected in the pasture samples collected in Austrian dairy farms. The exact mean, SD, median, min and maximum values are shown in Table 1.

