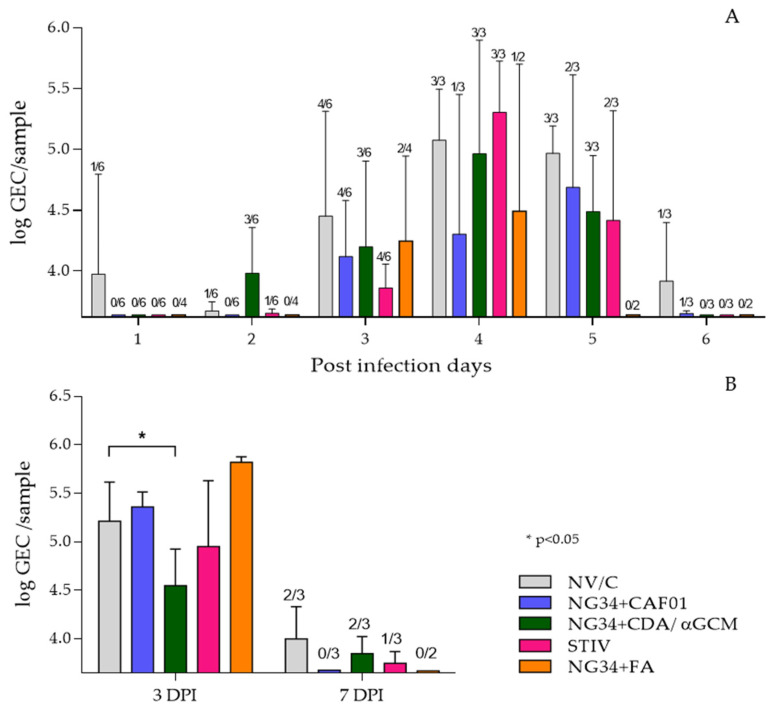
Figure 2.
Results obtained by RTqPCR analysis from nasal swabs (A) and bronchoalveolar lavage (B). Viral load in nasal swabs is represented as log GEC/sample of Influenza M protein gene from purified RNA of nasal swabs or BALF. Bars express averages and error bars the SD of each group. The number of animals with positive signal in qRT-PCR are represented above each bar in the figure.

