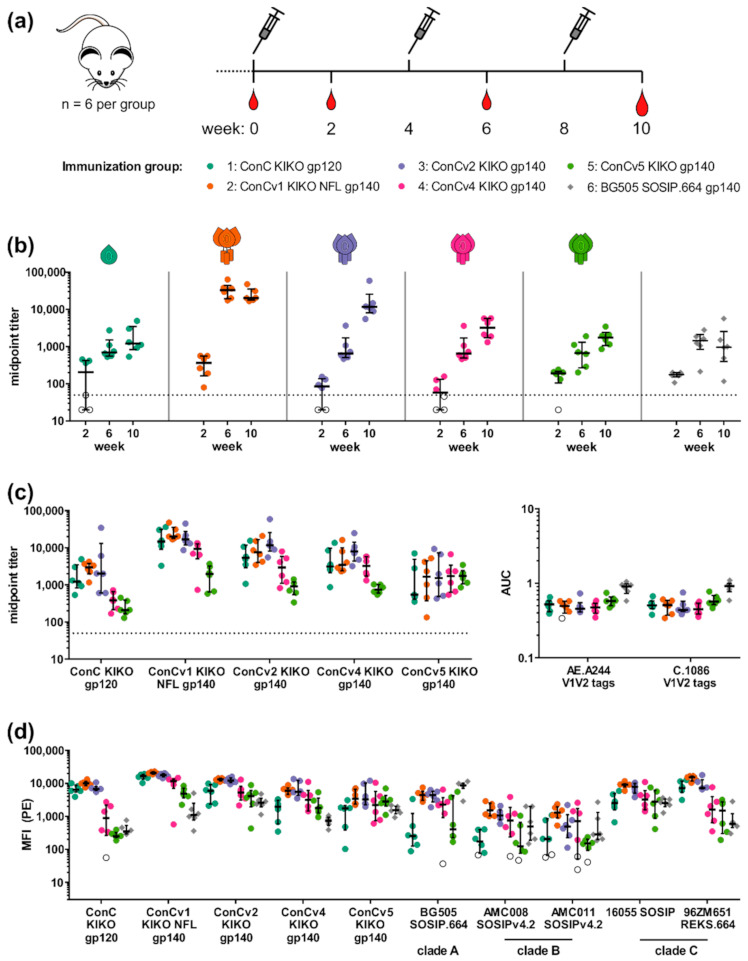
Figure 4.

The degree of stabilization of the immunogen impacts quality and quantity of immune responses. (a) Immunization schedule of mouse study (n = 6 per group). Immunizations (syringe) and bleeds (blood drop) are indicated at the respective weeks. List of immunization groups is given below. (b) Development of autologous midpoint titers over time. Midpoint titers for each animal to the respective homologous protein are given for the three bleeds in weeks 2, 6, and 10. Non-responders (i.e., sera with midpoint titers below the lowest serum dilution factor of 50 represented by the dotted line) are indicated with empty symbols. Data are shown as median with interquartile range. (c) Analysis of binding for week 10 sera from groups 1–5 to the autologous and the respective heterologous ConC derivatives. Data are shown as median and interquartile range. The dotted line indicates the dilution factor (50) of the lowest serum dilution (left). Analysis of serum binding to V1V2 proteins (right). Cumulative biding (area under curve, AUC) was determined for the binding curves to the V1V2 proteins and data are shown as median and interquartile range and non-responders are indicated as empty symbols. (d) Analysis of IgG binding to all ConC Env variants and a panel of heterologous trimers from clades A (BG505 SOSIP.664), B (AMC008 SOSIPv4.2, AMC011 SOSIPv4.2), and C (16055 SOSIP, 96ZM651 REKS.664) in a Luminex multiplex assay. Non-responders were determined based on the binding of sera from naïve animals to the respective Env variants. Data are shown as median and interquartile range, and non-responders are shown as empty symbols.
