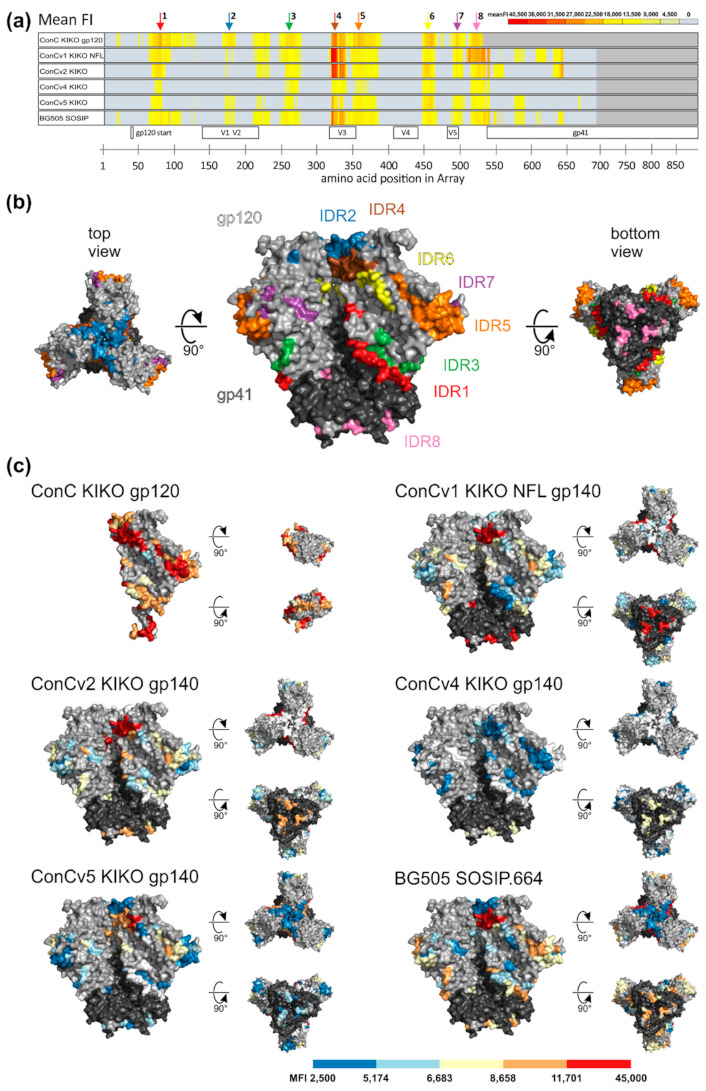
Figure 5.

Degree of Clade C consensus immunogen stabilization impacts Env IgG recognition patterns. (a) Heat map of mean fluorescence intensity (FI) plotted against individual antigenic regions along the entire HIV-1 Env as included in the peptide microarray. Heat maps of antigenic regions targeted by Env-specific IgG responses are shown for all vaccination groups 2 weeks after the final vaccination. Each row represents one vaccination group comprised of six animals each. FI values corresponding to each 15-mer peptide were mapped to the 10 full-length Env sequences included in the peptide array. Responses above 2500 FI (assay background) after baseline subtraction (pre-vaccination response) were considered positive and the maximum response was selected per position. The mean FI depicted in the graphs was calculated from the maximum FI per amino acid position of each vaccinee per group and is shown for positive responses against peptide positions with a response in at least two animals. Immunodominant regions (IDRs) 1–8 are indicated by colored arrows. Dark grey areas demark the end of the immunogens. (b) IDRs are depicted on the accessible surface area (ASA) of a representative pre-fusion Env trimer (PDB: 6CK9; ConC_Base0). (c) Mean FI values for each immunization group are mapped on the trimer surface within the previously defined IDRs. For the color code, all positive responses were ranked and distributed in five groups of the same size. Negative responses are shown in white.
