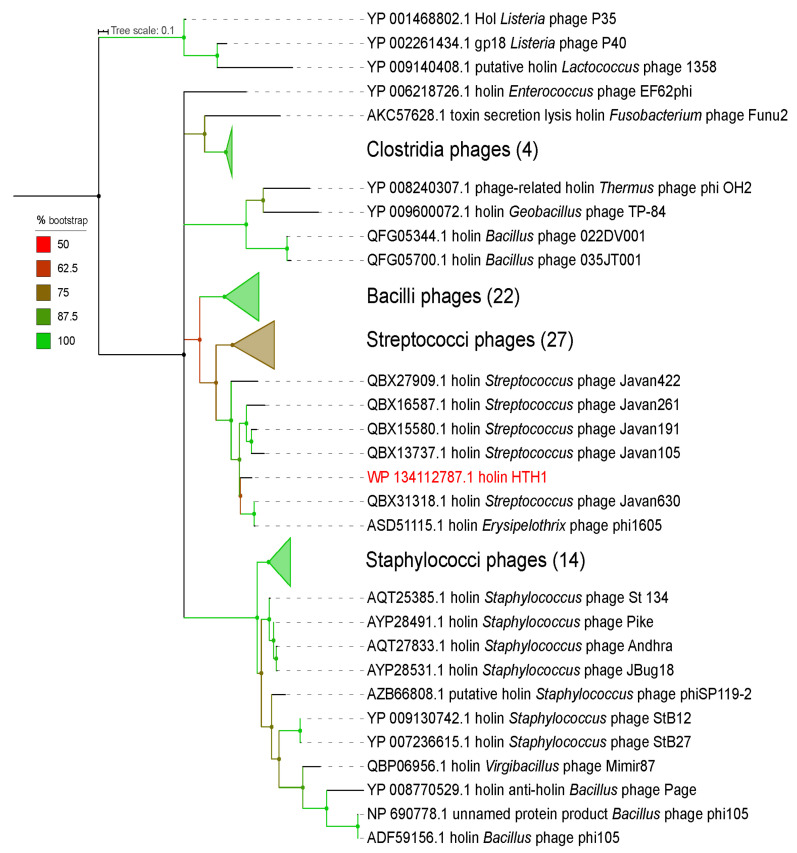
Figure 1.
Phylogeny analysis of the prophage based on the alignment of 106 amino acid long region of holin proteins from 94 phages, using maximum likelihood, with 1000 bootstrap replicates. The tree is centre-rooted, and the scale bar represents the average number of amino acid substitutions per site. Numbers next to collapsed clades represent the number of leaves covered by each illustration. The HTH1 holin is highlighted in red.

