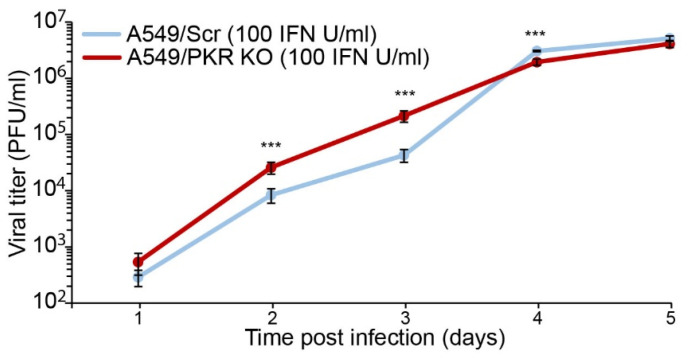
Figure 3.
TCRV viral progeny production in IFN-stimulated A549/Scr and A549/PKR KO cells. Cells were stimulated with 100 IU/mL of rIFN-αA/D 24 h before infection. Cells were infected at MOI 0.01 PFU/cell and supernatants were assayed for viral titer by IFA. Error bars represent standard deviations (n = 4) and asterisks (***) means statistical significance (p < 0.01) in two-way ANOVA test.

