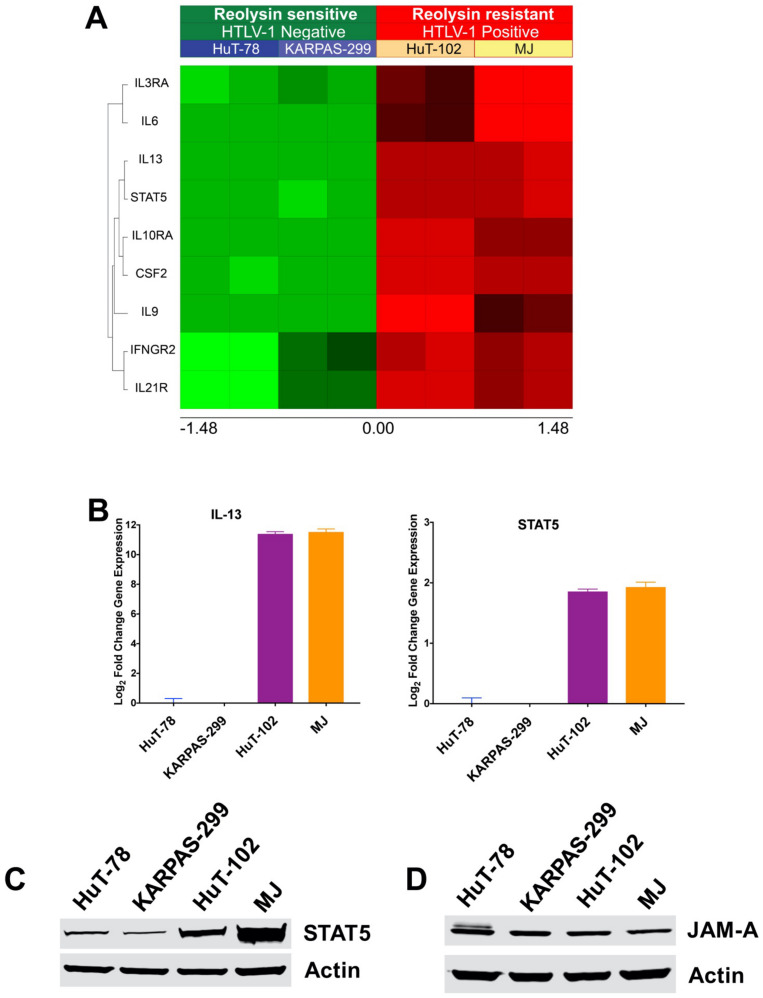
Figure 3.
HTLV-1-positive TCL cells exhibit upregulated IL-13 and STAT5 expression. (A) Transcriptome analysis of HTLV-1-negative (HuT-78 and KARPAS-299) and HTLV-1-positive (HuT-102 and MJ) cell lines reveals significant alterations in JAK/STAT pathway-related genes including upregulation of IL-13 and STAT5. Gene expression changes were determined using Affymetrix expression arrays. Significantly upregulated genes are illustrated in the heatmap. (B) IL-13 and STAT5 levels are increased in HTLV-1-positive TCL cells. IL-13 and STAT5 expression was measured by quantitative real-time PCR in TCL cells. Mean ± SD, n = 3. (C) STAT5 expression is upregulated in HTLV-1-positive TCL cells. Immunoblotting determined that HuT-102 and MJ cells display increased expression of STAT5 compared to HTLV-1-negative TCL cells. (D) JAM-A expression is similar in 4 TCL cell lines. JAM-A levels were measured by immunoblotting.

