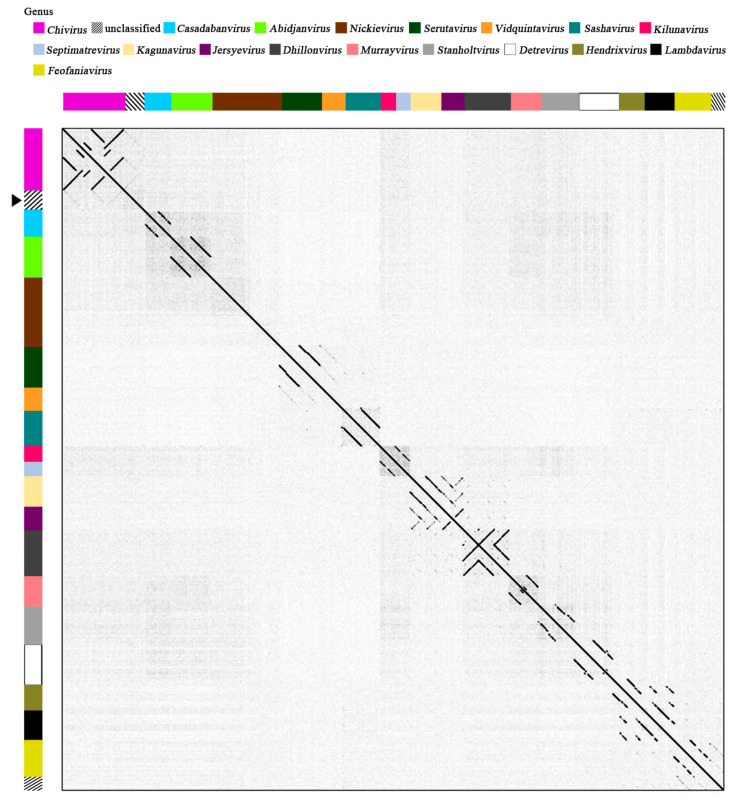
Figure 5.
Comparative analysis of whole genome sequences of the phage pEp_SNUABM_08 and related phages using dot plot. The pEp_SNUABM_08 phage isolated in the present study is highlighted using a black arrow ( ). The arrangement of sequences was paralleled with the whole-genome sequence phylogeny (Figure 4).

