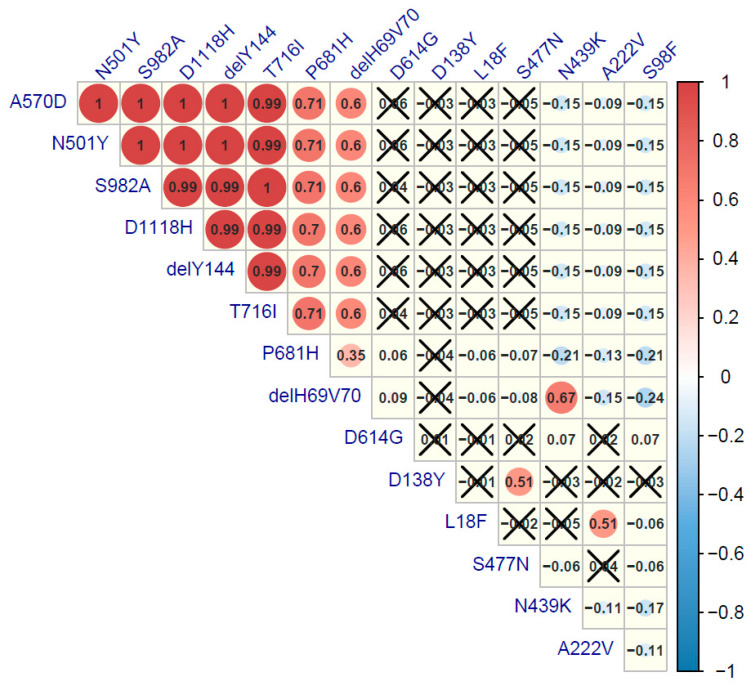
Figure 6.
Correlation plot of major spike mutations in SARS-Cov-2 isolates from Poland. Positive correlations are displayed in red and negative correlations in blue. The color intensity and the circle size are proportional to the correlation coefficient values. Spearman’s rank test was performed, and a p-value ≤ 0.05 was considered as significant. Correlation coefficient values with greater p-value are cross-marked.

