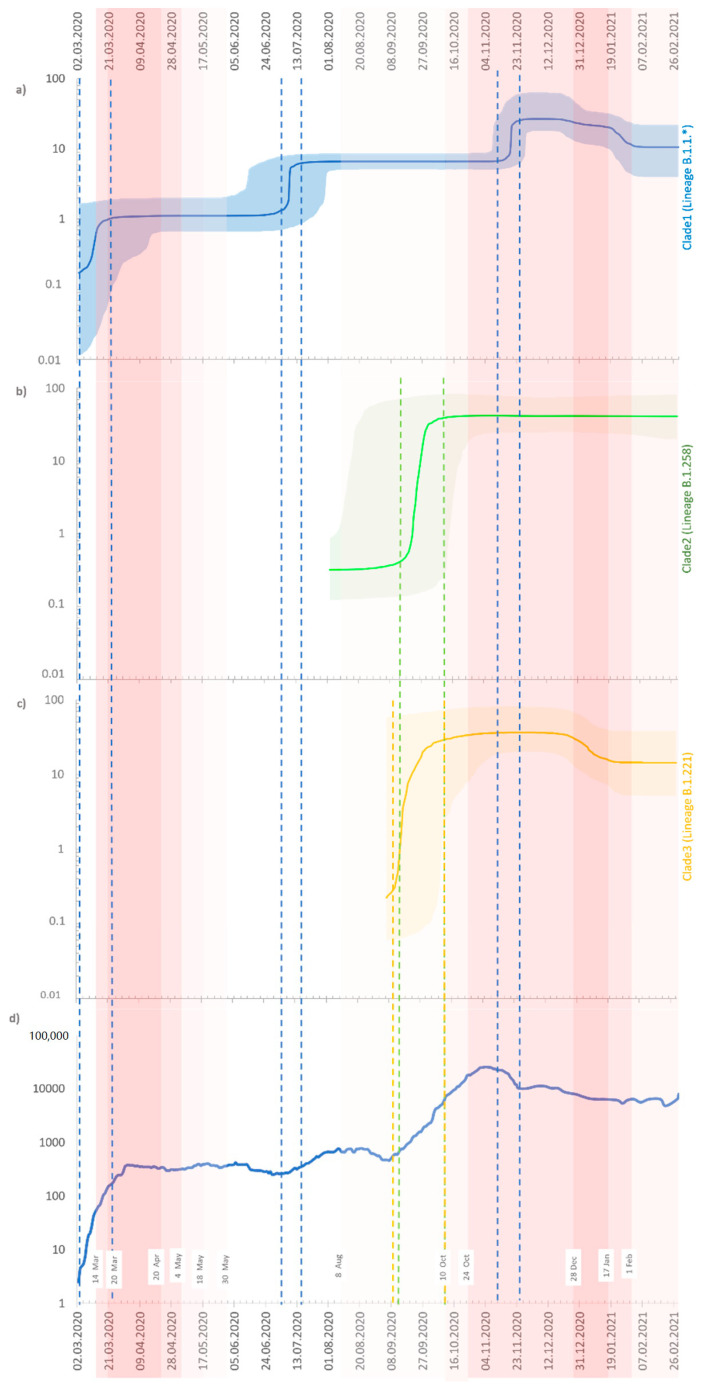
Figure 8.
Bayesian skyline plot of the Polish SARS-CoV-2 outbreaks. (a) Clade 1 (lineages: B.1.1.*—for details see Supplementary Materials); (b) Clade 2 (lineage: B.1.258); (c) Clade 3 (lineage: B.1.221); and (d) registered cases of COVID-19 in Poland (https://www.gov.pl/web/coronavirus, accessed on 22 June 2021). For (a–c), the Y-axis indicates effective population size (Ne), and the X-axis shows the time. The thick solid line represents the median value of the estimates, and the shaded area the 95% HPD (highest posterior density). For (d), four different red color intensities exhibit the four-stage restrictive measures implemented by the government at the country level. White rectangles indicate dates of introduction/abolition of the restrictions.

