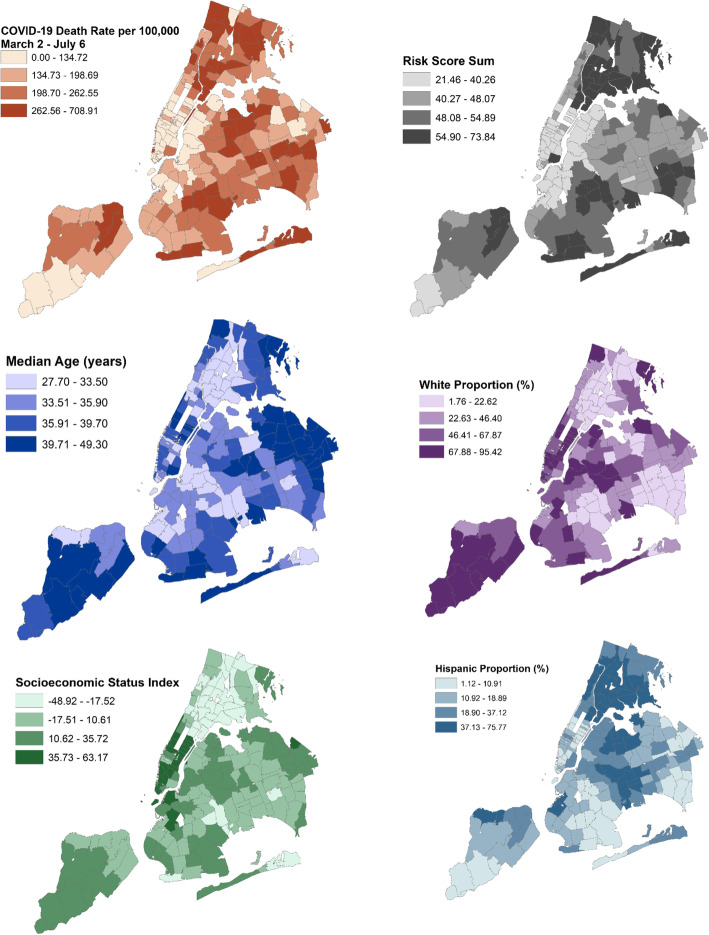
Fig. 1.
Distribution of the COVID-19 death rate per 100,000 residents from March 2nd to July 6th (top-left), the risk index (top-right), the median age (middle-left), the proportion white residents (middle-right), the socioeconomic status index (bottom-left) and the Hispanic composition (bottom-right) across New York City Zip Code Tabulation Areas. The risk index is a sum score of quartiles of asthma prevalence + cancer prevalence (excluding skin cancer) + COPD prevalence + diabetes prevalence + heart disease prevalence + hypertension prevalence + kidney disease prevalence + obesity prevalence + Heart attack prevalence + proportion of the population aged ≥65 years + birthrate prevalence and liver disease (measured by summing quartiles of Hepatitis B prevalence, Hepatitis C prevalence and alcohol hospitalizations prevalence). The socioeconomic status index was constructed from principal component analysis of 2018 American Community Survey estimates of median household income in the past 12 months, median gross rent, percent living below 150% of the poverty line, education, percent working class, percent unemployed, > 1 occupants per room. The education index was calculated on the population ≥ 25 years and is a weighted combination of the percent high school graduate, high school only, and more than high school, with a greater value indicating higher educational attainment. This figure was created using our licensed copy of ArcGIS (version 10.7.1; ESRI, Redlands, CA)

