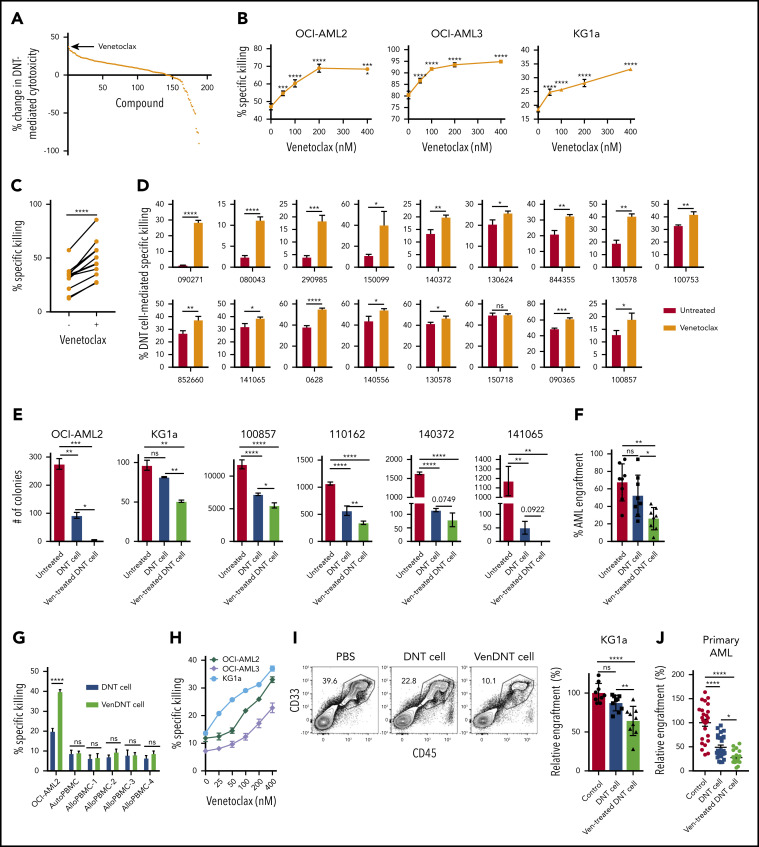
Figure 1.
Venetoclax increases antileukemic activity of T cells. (A) A total of 189 drugs were added to ex vivo expanded DNTs (50 000 cells per well) in 96 well plates at a final concentration of 400 nM for 18 hours. The compound-treated DNTs were washed and incubated with OCI-AML2 at a 2:1 ratio for 2 hours. AML cell viability was determined by Annexin V using flow cytometry. Data represent the change in cytotoxicity relative to untreated DNT control. (B) DNTs were treated with increasing concentrations of venetoclax for 18 hours followed by coculture for 2 hours with OCI-AML2 and OCI-AML3 at a 2:1 and KG1a at an 8:1 DNT to AML ratio. The viability of AML cells (CD3– CD33+ or CD34+) was determined as described in panel A. Each experiment was done in triplicate, and data represent the mean ± SD specific killing from 1 of 5 independent experiments conducted by using DNTs from different donors. (C) DNTs expanded from 11 donors were untreated or treated with 400 nM venetoclax for 18 hours. Subsequently, they were cultured with OCI-AML2 at a 1:1, 2:1, or 4:1 DNT:AML ratio, and the viability of AML cells was measured by Annexin V staining and flow cytometry. Each paired symbol represents DNTs from an individual donor. (D) Venetoclax 400 nM treated or untreated DNTs were cocultured with primary AML samples (n = 17) at a 2:1 ratio for 2 hours. After incubation, cell viability was measured as described in panel A. Each sample was measured in triplicate, and data represent the changes in AML cell death in the presence of venetoclax-treated DNTs relative to untreated DNTs. DNTs from 6 different donors were used for the screening. (E) OCI-AML2, KG1a, or primary AML cells (100857) were treated with DNT or venetoclax-treated (Ven-treated) DNTs for 18 hours. Equal volumes (105 cells per mL per dish) of cells were seeded in colony-forming assays, and the colonies were counted. Data represent mean ± SD of number of colonies formed. The results for OCI-AML2 and KG1a are representative of 3 independent experiments conducted by using DNTs from 2 different donors. (F) Primary AML cells (ID: 130607) untreated or treated with DNTs or venetoclax-treated DNTs for 2 hours at a 2:1 DNT:AML ratio were injected intrafemorally into NOD/SCID mice (1.6 × 10⁶ cells per mouse; n = 6 per group). Six weeks after injection, the percentage of AML engraftment (human CD45+ CD33+ cells) in the bone marrow from each group was determined by flow cytometry. (G) OCI-AML2, autologous PBMCs, or allogeneic PBMCs (n = 4) were used as targets and cultured with DNTs or venetoclax-treated DNTs for 2 hours at a 2:1 DNT to AML ratio or 8:1 DNT to PBMC ratio. The viability of AML cells and PBMCs was determined by Annexin V. Data represent the mean ± SD specific killing. The results are representative of 2 independent experiments. (H) Ex vivo expanded polyclonally activated CD4+/CD8+ Tconv cells were treated with increasing concentrations of venetoclax for 18 hours. Tconv cells were added as effectors against OCI-AML2, OCI-AML3, and KG1a at a 4:1 target ratio. Two hours after incubation, AML cell viability was determined by Annexin V. Data represent the mean ± SD specific killing from 1 of 5 independent experiments. (I) Sublethally irradiated (250 cGy) NSG mice were injected intravenously with KG1a cells (2 × 10⁶ cells per mouse). Two weeks post-KG1a infusion, mice were treated with 3 infusions of vehicle control (phosphate-buffered saline [PBS]) or 1.5 to 2 × 10⁷ cells per infusion of DNTs or venetoclax-treated DNTs 3 to 4 days apart. Five weeks post–AML injection, bone marrow engraftment of KG1a (human CD45+ CD34+) was determined by using flow cytometry. The result shown is representative of 2 independent experiments conducted by using 2 different donor-derived DNTs. (J) Sublethally irradiated NSG mice were intravenously injected with primary AML cells (n = 4; 2-5 × 10⁶ per mouse). Two weeks later, mice were treated with 3 infusions of vehicle control or 1.5 to 2 × 10⁷ cells per infusion of DNTs or venetoclax-treated DNTs, 3 to 4 days apart. Five weeks post–AML injection, bone marrow engraftment of primary AML cells (human CD45low CD33+ with or without CD34 expression) was determined by flow cytometry. Left: representative contour plot of bone marrow cells from each group stained with CD45 and CD33. Right: summarized results from patient-derived xenograft experiments performed by using 4 different primary AML patient samples. Horizontal bar represents the mean of bone marrow AML engraftment level normalized to vehicle control group; each symbol represents an individual mouse, and error bars represent SD. Data represent the mean ± SEM reduction in bone marrow leukemia level relative to the PBS group. Student t test or 1-way analysis of variance was used for statistics. *P < .05; **P < .01; ***P < .001; ****P < .0001. ns, not significant.

