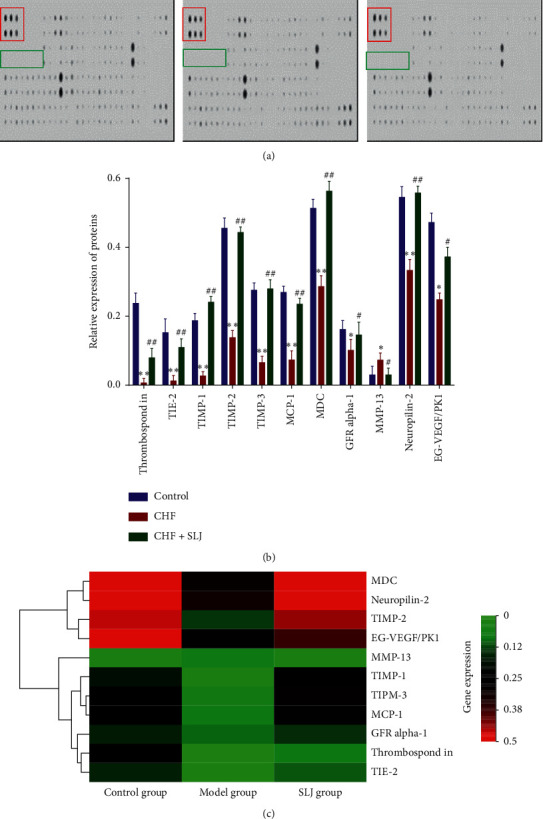
Figure 4.

Analysis of antibody microarrays. (a) Image of protein chip data. Red box, positive control; green box, negative control. (b) A total of 11 proteins with significantly different expression levels were associated with SLJ treatment of CHF, as detected by protein array. (c) Heat map of protein microarray data reflecting the expression levels of the 11 proteins. Samples are indicated in columns and proteins in rows. Red, increased expression in SLJ treatment samples compared with CHF samples; green, decreased expression level; black, median expression. n = 3. ∗P < 0.05 and ∗∗P < 0.01 vs. the control group. #P < 0.05 and ##P < 0.01 vs. the CHF group. SLJ, Shenlijia; CHF, chronic heart failure.
