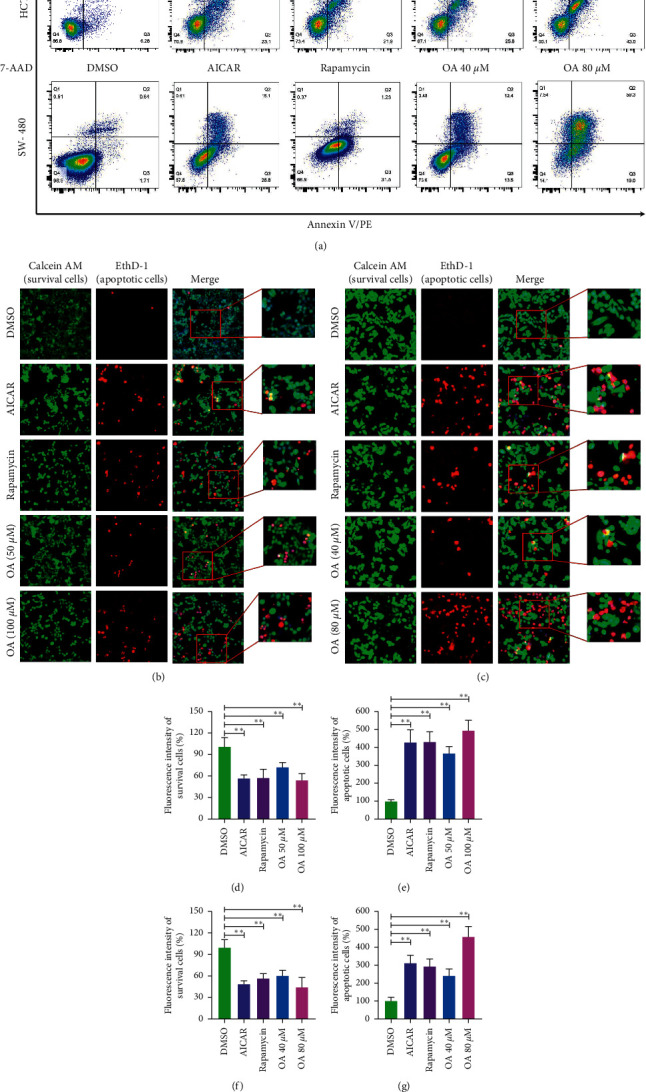
Figure 4.

Apoptosis of CC cells induced by AICAR, rapamycin, and OA. (a) Apoptosis rate of HCT-116 and SW-480 cells detected by FCM. (b) Morphological features of HCT-116 cells. Survival cells (green fluorescence) and apoptotic cells (red fluorescence) were reflected by fluorescence staining intensity. (c) Morphological features of SW-480 cells. Survival cells (green fluorescence) and apoptotic cells (red fluorescence) were reflected by fluorescence staining intensity. (d) Survival cells count of HCT-116 cells. (e) Apoptotic cells count of HCT-116 cells. (f) Survival cells count of SW-480 cells. (g) Apoptotic cells count of SW-480 cells. ∗∗P < 0.01 versus DMSO group.
