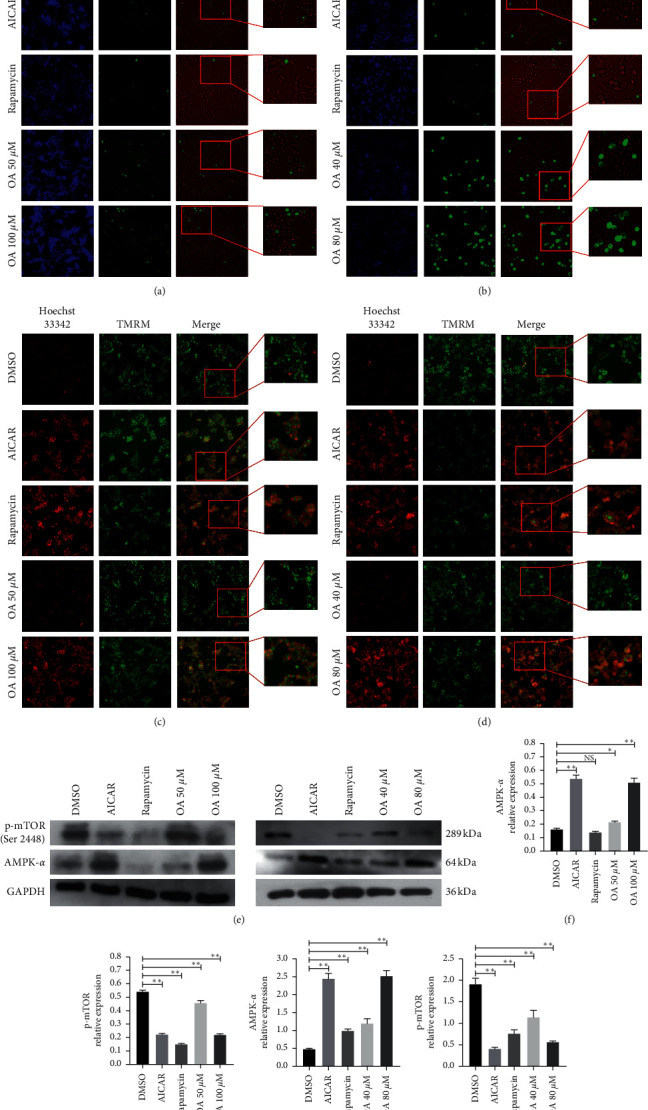
Figure 5.

Influences of OA on the F-actin, mitochondrial membrane potential, and protein expression of HCT-116 and SW-480 cells. (a) F-actin identification of HCT-116 cells. Positive expressions were stained by green fluorescence. (b) F-actin identification of SW-480 cells. Positive expressions were stained by green fluorescence. (c) Mitochondrial membrane potential of HCT-116 cells. Nondepolarized membrane potential was stained by green fluorescence; depolarized membrane potential was stained by red fluorescence. (d) Mitochondrial membrane potential of SW-480 cells. Nondepolarized membrane potential was stained by green fluorescence; depolarized membrane potential was stained by red fluorescence. (e) WB images of AMPK-α and p-mTOR (Ser 2448). (f) Relative AMPK-α protein level in HCT-116 cells. (g) Relative p-mTOR (Ser 2448) protein level in HCT-116 cells. (h) Relative AMPK-α protein level in SW-480 cells. (i) Relative p-mTOR (Ser 2448) protein level in SW-480 cells.
