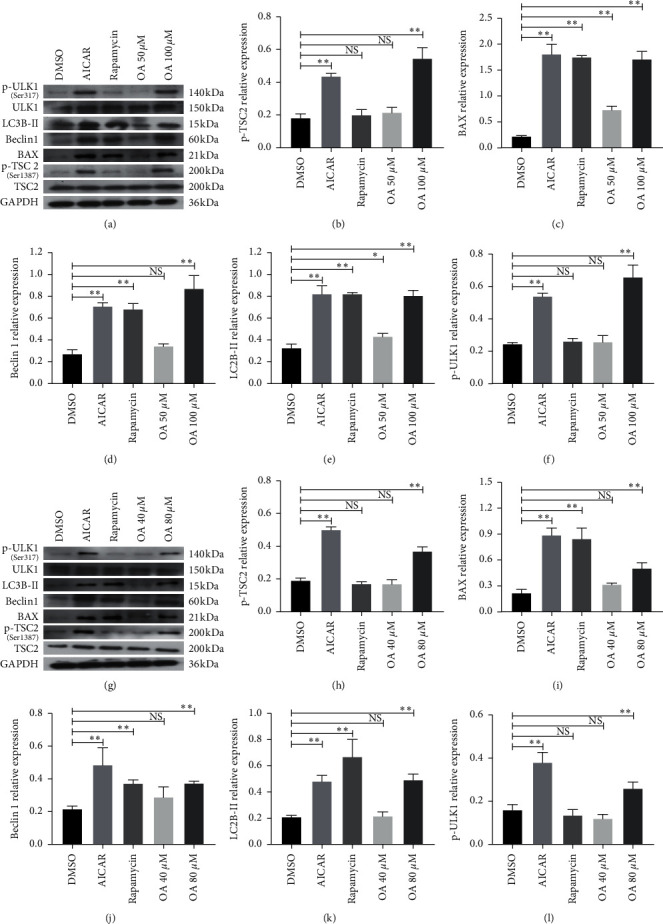
Figure 7.

(a) Western blotting images of TSC2, p-TSC2 (Ser 1387), BAX, Beclin 1, LC3B-II, ULK1, and p-ULK1 (Ser 317) in HCT-116 cells. (b) Relative p-TSC2 (Ser 1387) in HCT-116 cells. (c) Relative BAX protein level in HCT-116 cells. (d) Relative Beclin 1 protein level in HCT-116 cells. (e) Relative LC3B-II protein level in HCT-116 cells. (f) Relative p-ULK1 (Ser 317) protein level in HCT-116 cells. (g) Western blotting images of TSC2, p-TSC2 (Ser 1387), BAX, Beclin 1, LC3B-II, ULK1, and p-ULK1 (Ser 317) in SW-480 cells. (h) Relative p-TSC2 protein level in SW-480 cells. (i) Relative BAX protein level in SW-480 cells. (J) Relative Beclin 1 protein level in SW-480 cells. (k) Relative LC3B-IIprotein level in SW-480 cells. (l) Relative p-ULK1 (Ser 317) protein level in SW-480 cells. NS: nonsignificant versus HCT-116 and SW-480 group; ∗P < 0.05 versus HCT-116 and SW-480 group; ∗∗P < 0.01 versus HCT-116 and SW-480 group.
