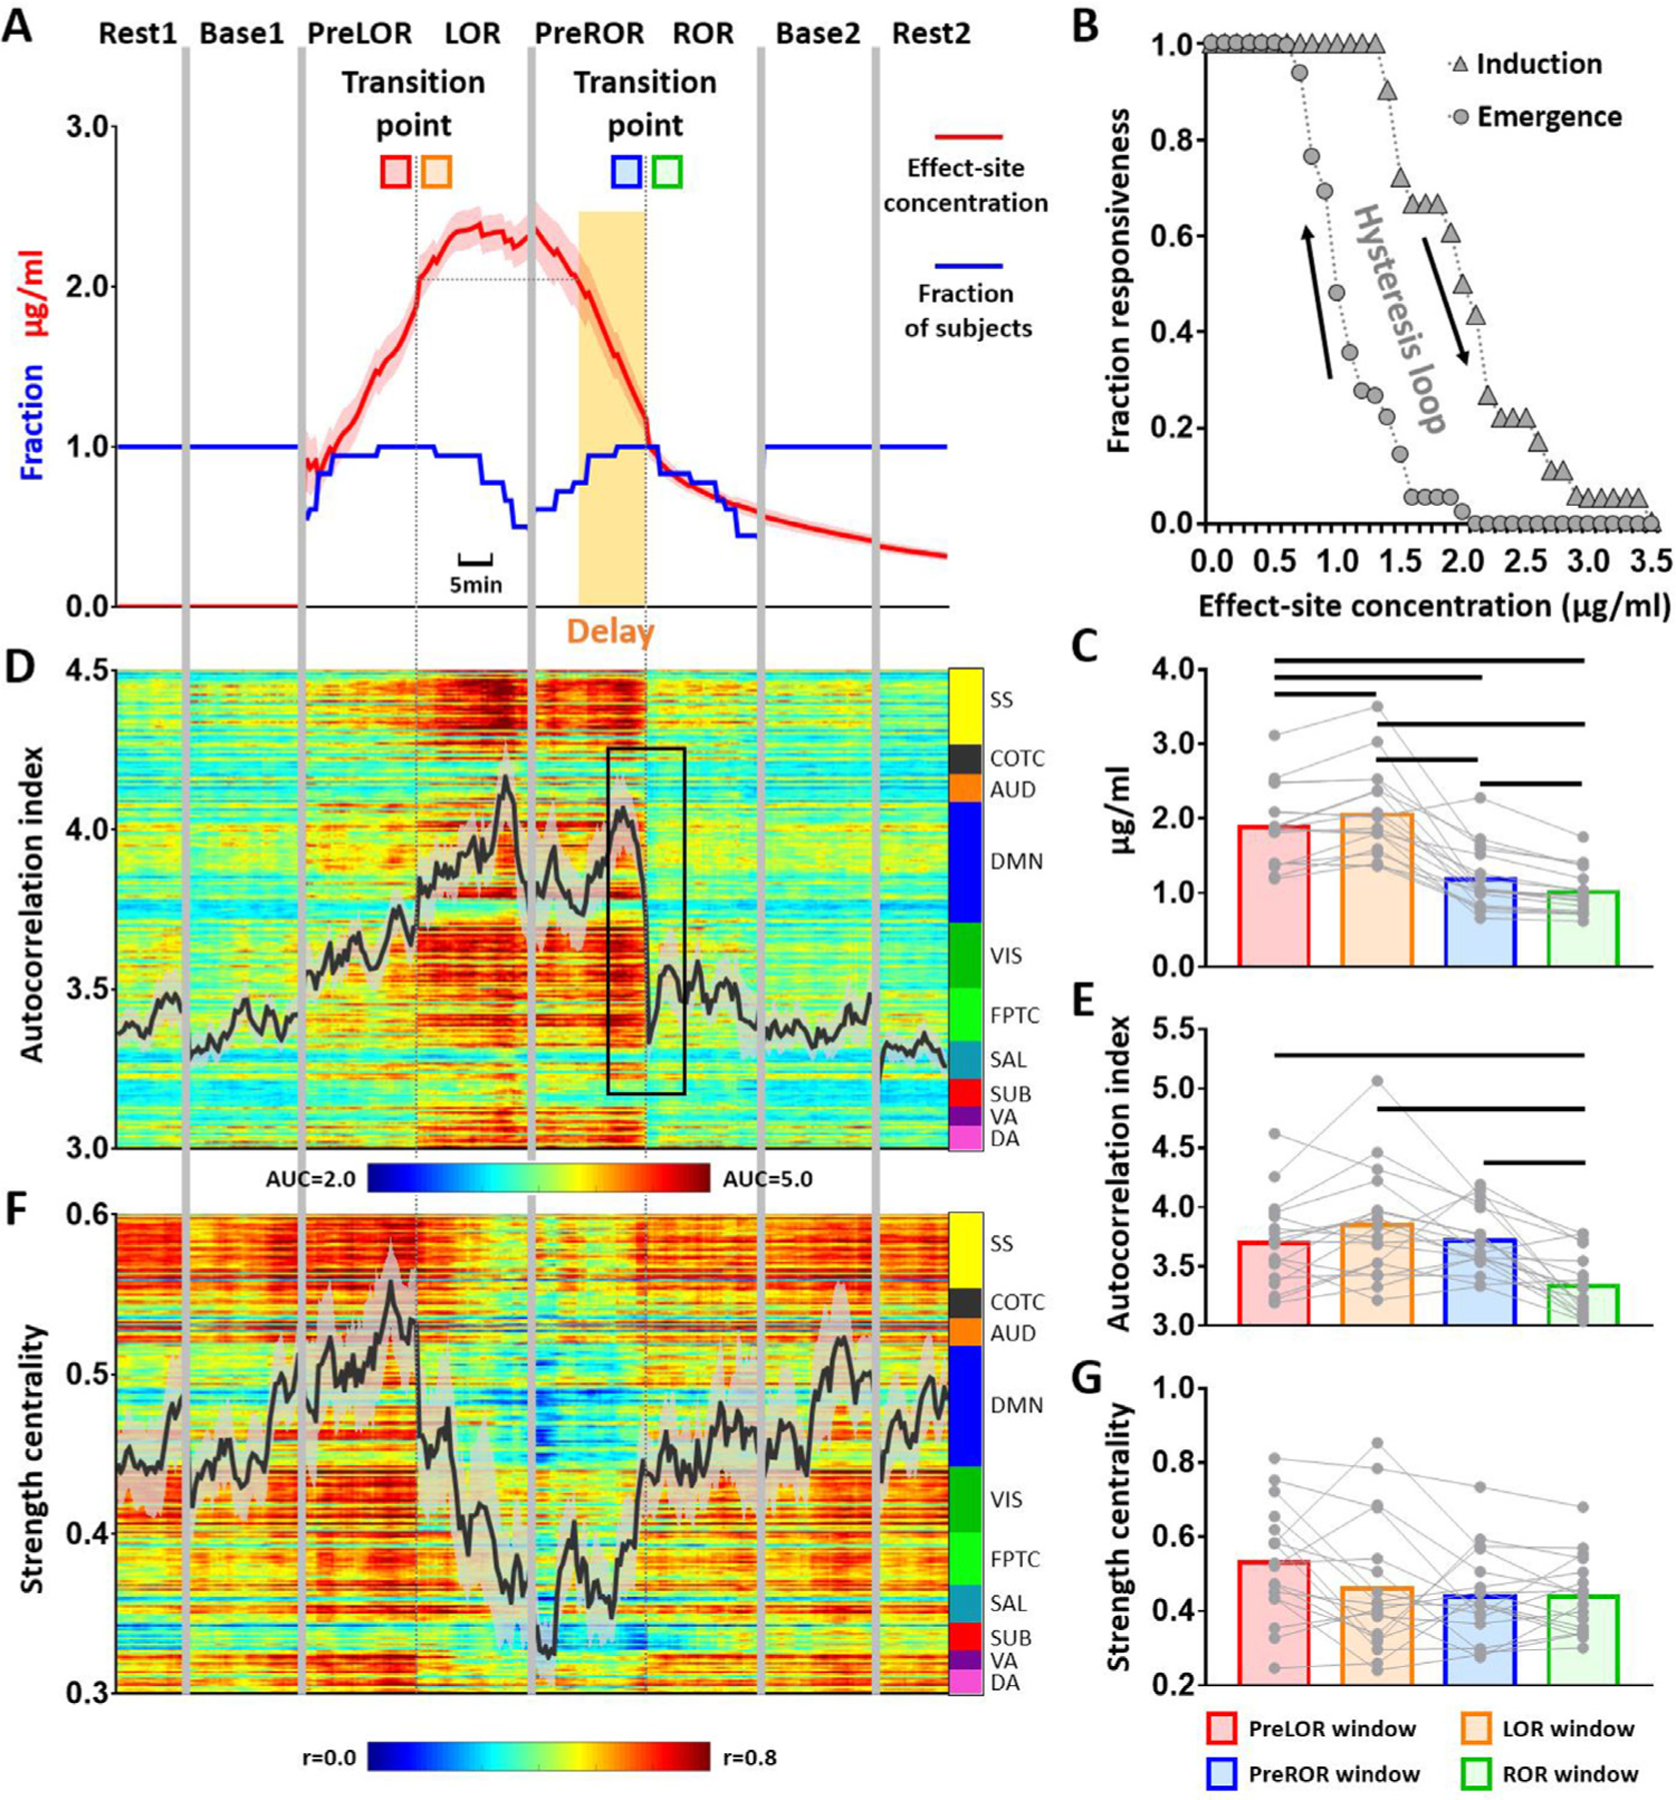
Fig. 2. Induction-emergence hysteresis and global changes of brain activity.

(A) Group average of propofol effect-site concentration (ESC). Given the data length of PreLOR, LOR, PreROR and ROR varied across participants, the transition points of LOR and ROR were used as two reference time points in order to align all participants’ data within the same timeline. The sliding window was moving forward and backward centered at the reference time points, with a maximum data length of 15 min in each time direction. The transition to ROR occurred at a lower ESC than during the transition to LOR. The delayed period in the recovery of behavioral responsiveness with respect to the same level of anesthetic dose at LOR is indicated by a yellow shaded area. (B) A hysteresis loop is shown by plotting the fraction of responsiveness (across subjects) vs. estimated propofol effect-site concentration. The area between the curves of induction and emergence represents a resistance to change in the state of consciousness. (D) Time course of global (gray matter average) autocorrelation index at the group-level. (F) Time course of global strength centrality at the group-level. (C, E, G) Measurements taken before and after LOR and ROR were statistically compared from 120 s data windows preceding (PreLOR and PreROR) and following (LOR and ROR) the state transition points by two-tailed paired-sample t-tests (df = 17). Black lines on the bars indicate statistical significance at FDR-corrected α < 0.05. Shaded areas in the time courses indicate ±SEM.
