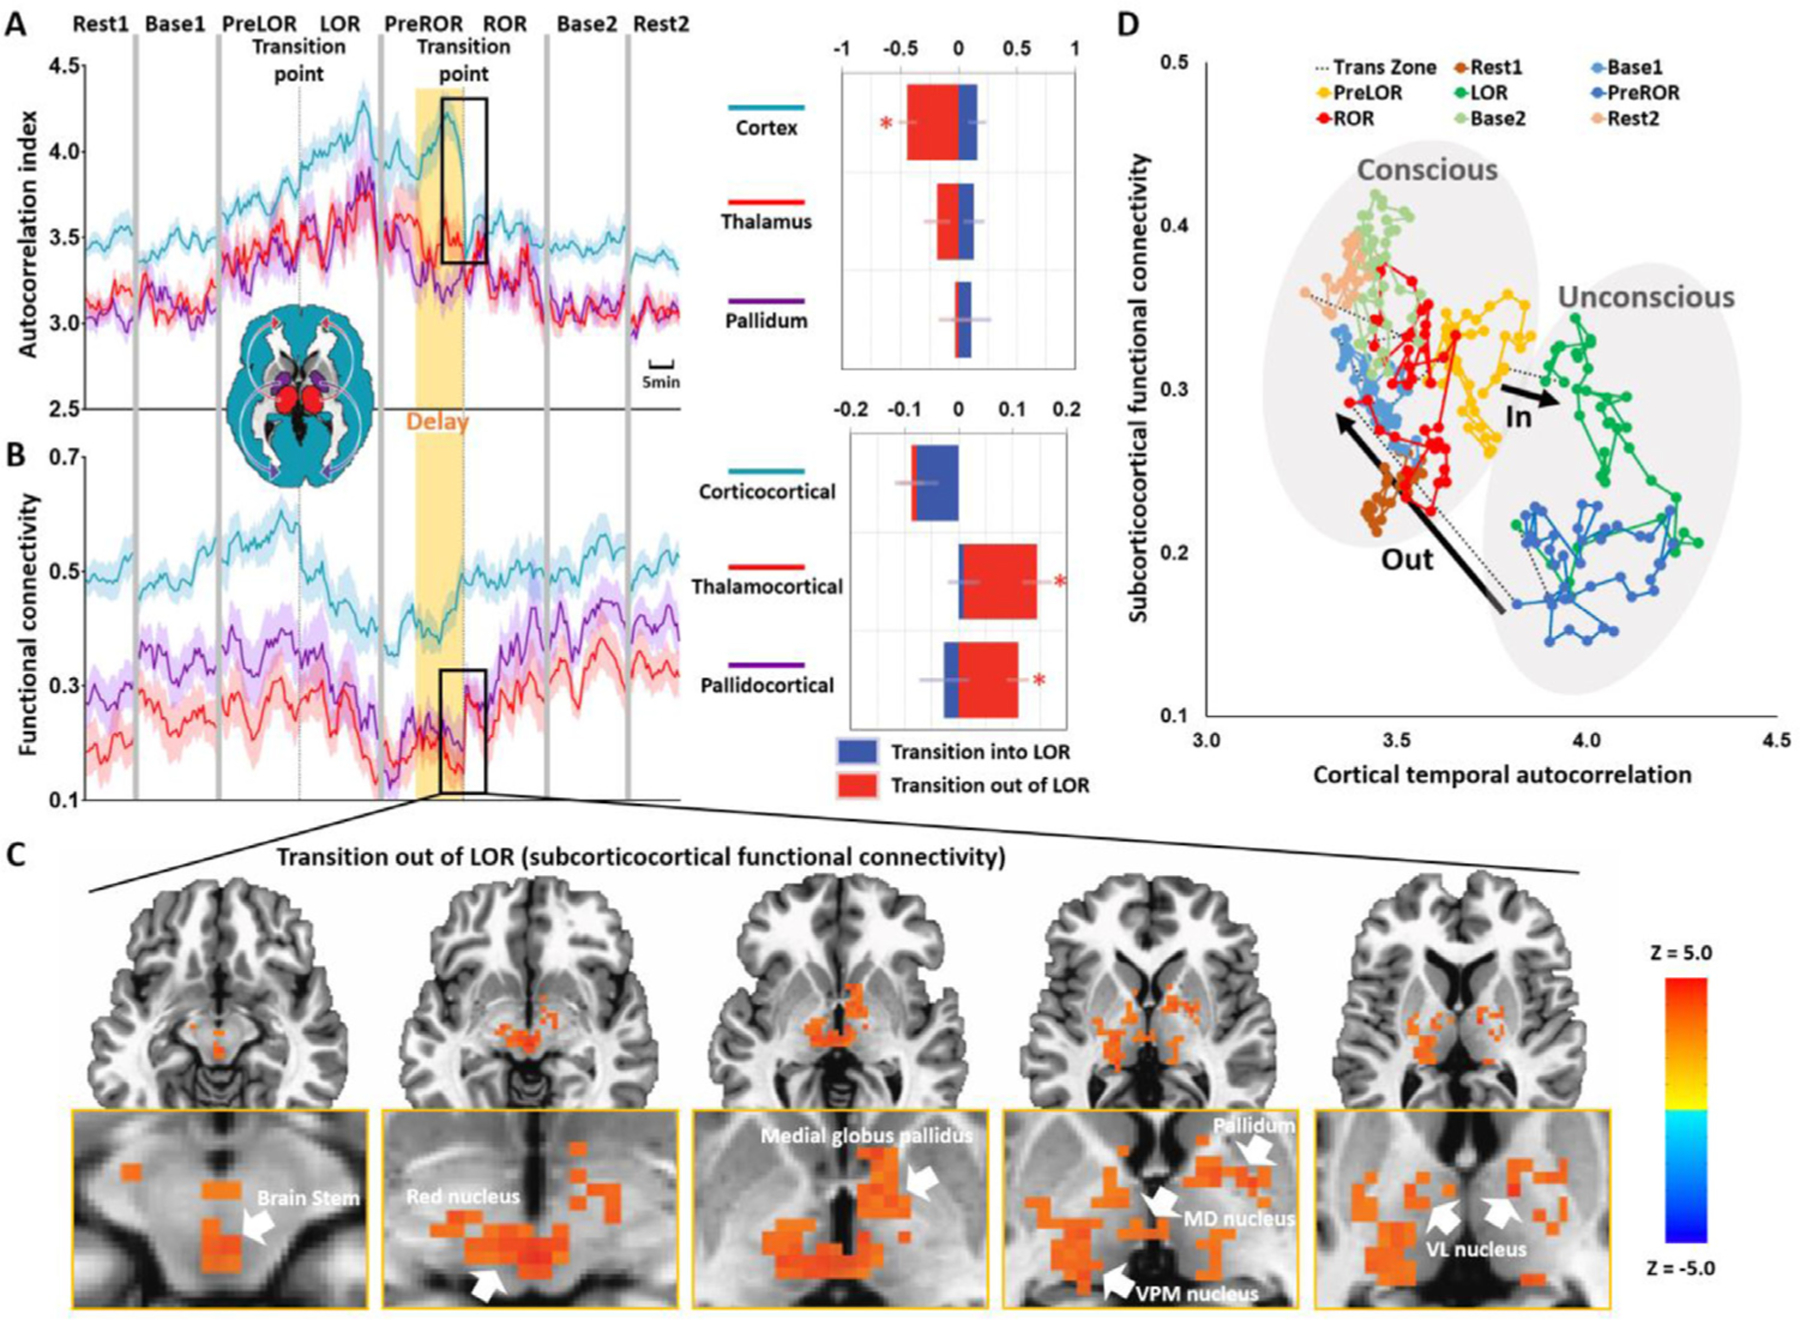
Fig. 5. Temporal trajectory of functional connectivity and temporal autocorrelation during state transitions.

(A) Time courses of autocorrelation index in the cortex, thalamus and pallidum at the group-level. (B) Time courses of corticocortical, thalamocortical and pallidocortical functional connectivity at the group-level. Asterisk (*) indicates statistical significance at FDR-corrected α < 0.05. Shaded areas in the time courses indicate ± SEM. (C) Whole-brain functional connectivity was calculated by using the average fMRI time series across the entire cortex as a regressor. Voxel-wise paired sample t-tests (two-sided) between PreROR window and ROR window were performed at the group-level. The resulting z-map was thresholded at the cluster level α < 0.05. The abrupt boost of subcorticocortical functional connectivity during regaining consciousness included the brain stem, red nucleus, medial globus pallidus, pallidum, medial dorsal (MD) nucleus, ventral posteromedial (VPM) nucleus and ventral lateral (VL) nucleus. (D) The trajectory of subcorticocortical functional connectivity (average of thalamocortical and pallidocortical functional connectivity) was plotted as a function of the cortical signal’s temporal autocorrelation.
