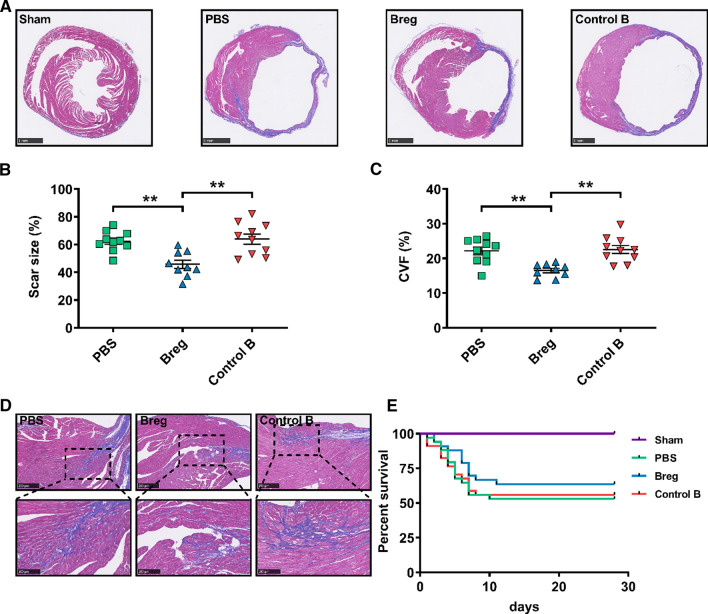
Fig. 2.
Adoptive transfer of Bregs reduces scar size and fibrosis post-MI. a Representative photomicrographs of scar size evaluated by Masson trichrome staining at day 28 post-MI. Scale bar: 1 mm. b Quantitative analysis of scar size evaluated by Masson trichrome staining at day 28 post-MI. n = 9–10 per group. c Fibrosis assessed by CVF in the peri-infarct zone was compared among the different treatments at day 28 post-MI. n = 9–10 per group. d Representative images showing collagen deposition (blue) evaluated by Masson trichrome staining 28 days after MI. Scale bar: 250 μm (top) or 100 μm (bottom). e Survival analysis of sham mice (n = 18), PBS-treated MI mice (n = 34), Breg-treated MI mice (n = 33), control B cell-treated mice (n = 34) up to 28 days following the operation. Data are expressed as means ± SEM. **P < 0.01. Data in b and c were analyzed by one-way ANOVA, followed by Tukey’s post hoc test. Survival distributions were estimated by the Kaplan–Meier method and compared by log-rank test. Sham sham-operated group, PBS MI mice that received phosphate buffered saline, Breg MI mice that received regulatory B cells, Control B MI mice that received control B cells, CVF collagen volume fraction

