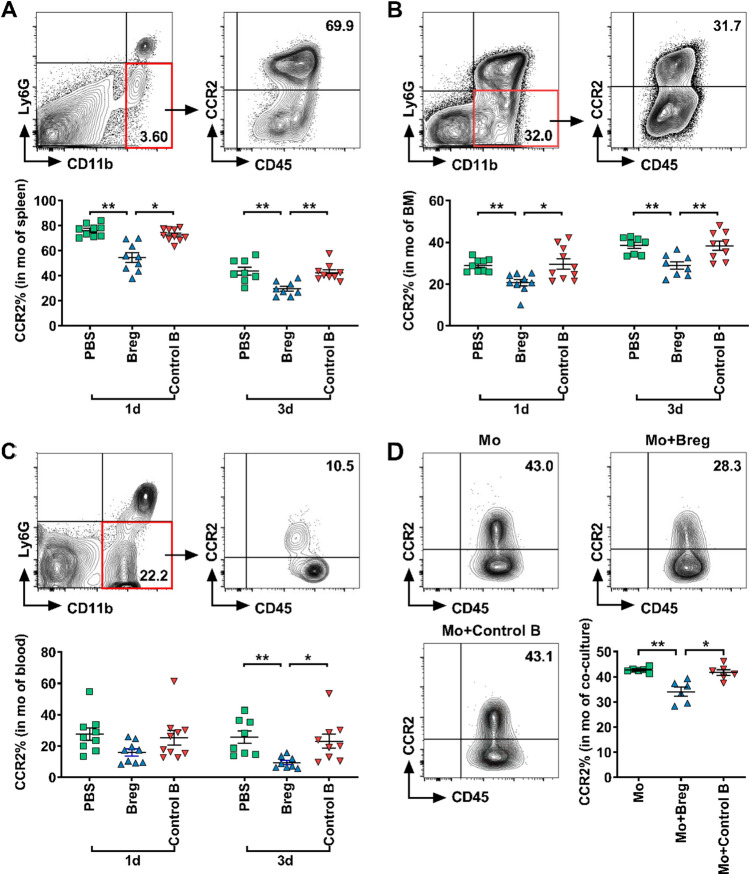
Fig. 6.
Bregs reduce CCR2 expression in monocytes. a–c Monocytes were collected from different tissues 1 and 3 days after MI and stained for CD45, CD11b, Ly6G and CCR2. Representative flow cytometric images and analysis of CCR2 expression in monocytes after MI in the spleen (a), bone marrow (b) and blood (c) are shown. n = 8–10 per group. d Monocytes sorted from the spleen were co-cultured with Bregs for 1 day, and the CCR2 expression in monocytes were detected using flow cytometry. Representative flow cytometric images and analysis of CCR2 expression in monocytes among the different treatments are shown. n = 6 per group. Data are expressed as means ± SEM. *P < 0.05, **P < 0.01. Data in a and b were analyzed by one-way ANOVA, followed by Tukey’s post hoc test (3d) or Kruskal–Wallis test with Dunn’s multiple comparisons test (1d). Data in c and d were analyzed by Kruskal–Wallis test with Dunn’s multiple comparisons test. PBS MI mice that received phosphate buffered saline, Breg MI mice that received regulatory B cells, Control B MI mice that received control B cells, 1d 1 day post-MI, 3d 3 day post-MI, Mo monocytes cultured alone, Mo + Breg monocytes co-cultured with regulatory B cells, Mo + Control B monocytes co-cultured with control B cells, mo monocytes, BM bone marrow

