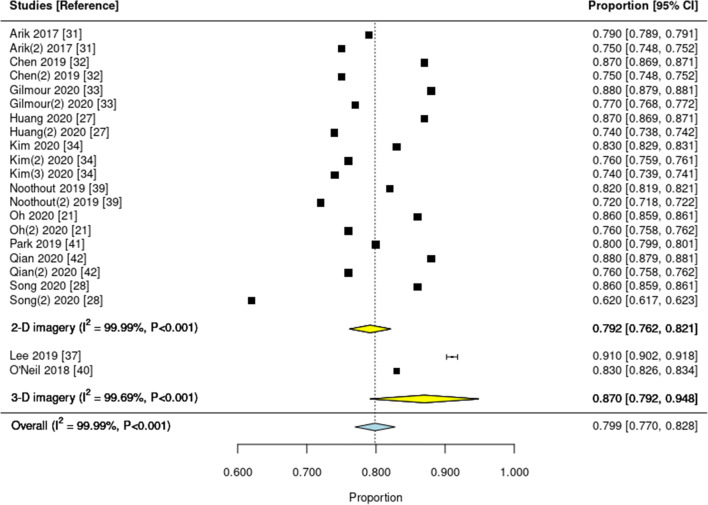
Fig. 3.
Forest plot of studies reporting the proportion of landmarks correctly predicted within a 2-mm prediction error threshold from the reference. Squares indicate the mean proportion found in each single study and lines the 95% confidence intervals (95% CI). Yellow and blue diamonds show the pooled subtotal (on 2-D and 3-D imagery) and overall estimates, respectively. I-square and the P value indicate heterogeneity. Studies are ordered according to year; if multiple test datasets were employed in the same study, the second or third is indicated accordingly (e.g., Arik 2017 (2))

