Figure 2.
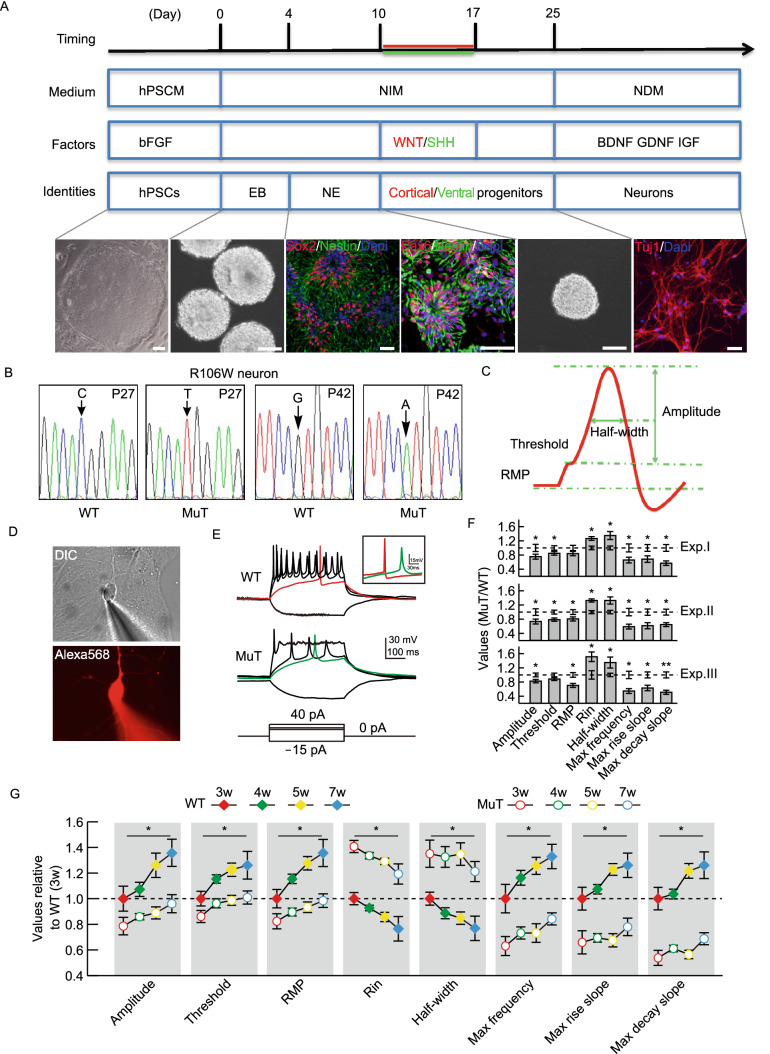
Consistent intrinsic electrophysiological phenotypes of RTT neurons. (A) Timeline of the neuronal differentiation protocol. Representative images show morphological changes during neural differentiation of isogenic hiPSCs. Neuro-progenitor cell (NPC) colonies, showing rosette structures, are positive for neural precursor markers Sox2, Pax6 and Nestin, whereas neurons are positive for Tuj1 (Bar: 50 μm). hPSCM, human pluripotent stem cell culture medium; NIM, neural induction medium; NDM, neural differentiation medium; hPSC, human pluripotent stem cell; EB, embryoid body; NE, neuroectoderm. (B) MeCP2 cDNA sequencing results from WT and R106W MuT neurons derived from passage 27 (P27) and passage 42 (P42) hiPSCs indicating absence of XCI erosion and X-chromosome reactivation even after 42 passages. (C) A schematic representing major parameters of active and passive membrane properties. (D) Representative DIC and fluorescence images of a hiPSC derived neuron during whole-cell recording. The lower panel shows the labeling of the neuron by infusion of Alexa 568 through the glass pipette. (E) Representative traces recorded from WT (upper panel) and MuT neurons (lower panel) in response to steps of current injection. (Bars: 30 mV and 100 ms). Insert shows the comparison of representative action potential traces from WT and MuT neurons (Bars: 15 mV and 30 ms). (F) Bar graphs showing active and passive membrane properties of MuT neurons normalized to WT neurons from three biologically independent experiments. n (WT1) = 43 neurons; n (WT2) = 47 neurons; n (MuT1) = 48 neurons; n (MuT2) = 43 neurons. Error bars stand for standard error. *P < 0.05, **P < 0.01. (G) Normalized quantification comparing active and passive membrane properties between WT and MuT neurons at four recording time points (3, 4, 5 and 7 weeks after plating on mouse astrocytes). Error bars stand for standard error. *P < 0.05

