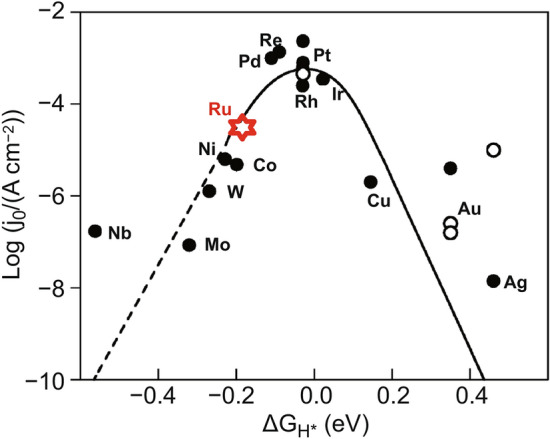
Fig. 1.

Volcano plot of hydrogen adsorption free energy (ΔGH*) of different metal catalysts in HER. With the exception of Ru, the data for the other metals are from the summary of Nørskov et al. High H coverage of metals on the left side of the volcano (1 monolayer (ML)), lower on the right side (0.25 ML). The dashed line indicates that the metals which bind H stronger than 0.2 eV H−1 usually form oxides at U = 0 V. The open circles are (111) data, whereas the filled circles are polycrystalline [25]. The data of Ru are from Hoster et al., corresponding to the calculation data of Ru (0001) at 1.1 ML [24]. With permission from the American Chemical Society and Springer Nature
