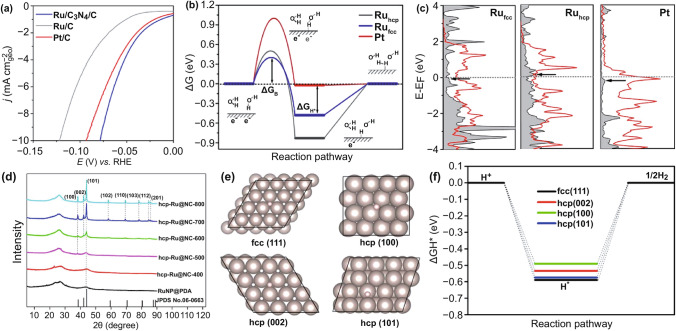
Fig. 3.
a–c HER polarization curves, Gibbs free energy diagram of HER on different metal surfaces and local density of states projected for the adsorbed H atom (H-DOS, dark shaded area) on three metal surfaces [35], with permission from the American Chemical Society. d–f XRD pattern of RuNP@PDA and hcp-Ru@NC annealed at various temperatures ranged from 400 to 800 ℃, H adsorption models and ΔGH* on different Ru surfaces, respectively [61], with permission from the American Chemical Society

