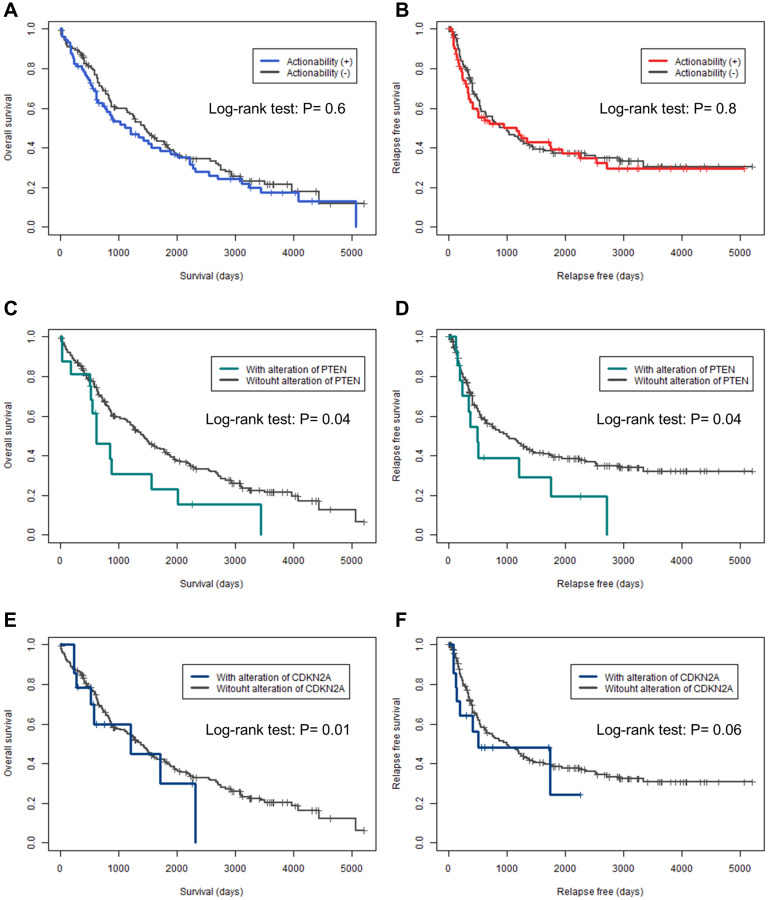
Figure 2. Kaplan–Meier curves for overall and relapse-free survival in actionable genes.
(A, C, E) Kaplan–Meier curves for overall survival. (B, D, F) Kaplan–Meier curves for relapse-free survival. (A, B) Actionability. (C, D) PTEN. (E, F) CDKN2A. The differences in overall survival and relapse-free survival were analyzed by log-rank test; P < 0.05 was considered statistically significant.

