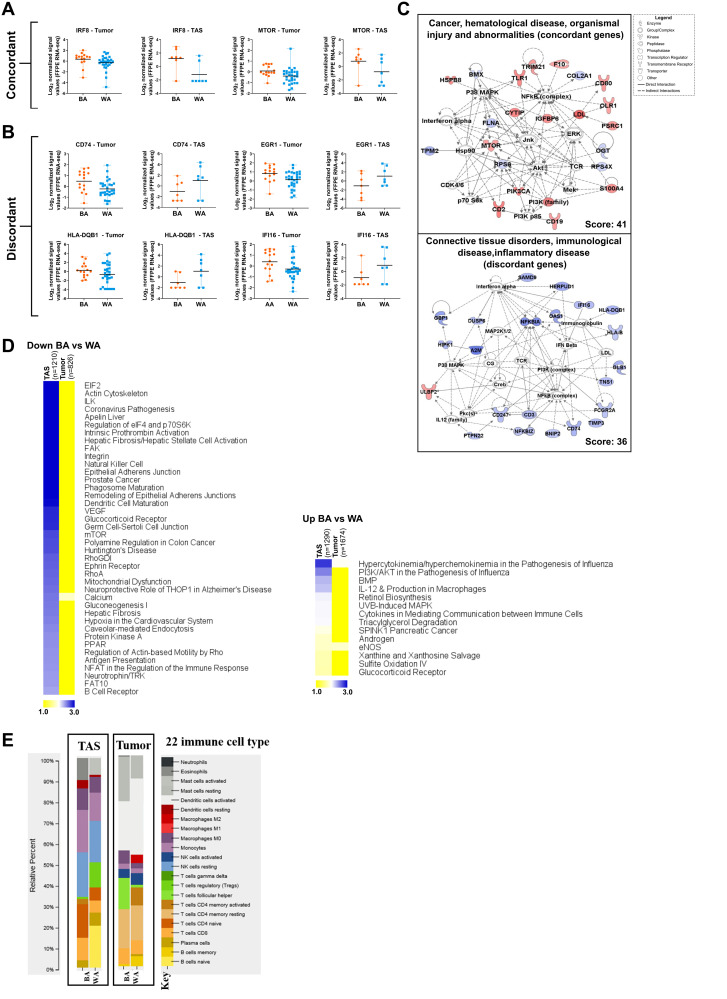
Figure 3. Comparative pathway analysis of significantly differentially expressed genes in BA versus WA PCa patients in tumor and tumor-adjacent stroma (TAS).
(A–B) The top 2500 significantly differentially expressed genes (padj < 0.05) in BA vs WA were compared in TAS and tumor. Notable overlapping genes with the same direction of regulations (concordant) and with different direction of regulation (discordant) in tumor and TAS of BA versus WA PCa patients are shown. Each dot represents a patient. (C) Gene network analysis of concordant and discordant genes in tumor and TAS of BA versus WA PCa patients. The networks shown are among those with the highest significance of connections between molecules in the network as indicated by their score. Blue nodes indicate downregulated and red nodes indicate upregulated gene expression in TAS of BA vs WA PCa patients. Darker shades of the nodes indicate larger differential expression ratios. Dotted lines represent indirect interactions while solid lines represent direct interactions. (D) Comparative pathway analysis of the top 2500 significantly differentially expressed genes (padj < 0.05) in BA and WA in both tumor and TAS cohorts with concordant and discordant regulations. The top overrepresented signaling pathways (-log10 p value > 1.30) between TAS and tumor in BA versus WA PCa samples among downregulated (left) and upregulated (right) genes are shown. The heat map is generated from the –log10 p values, using MeV (http://mev.tm4.org). n is the number of genes. (E) CIBERSORT analysis of 22 immune cell types in tumor epithelia of BA (n = 15) and WA (n = 30) (p < 0.05) and TAS of BA (n = 7) and WA (n = 7) PCa patients.

