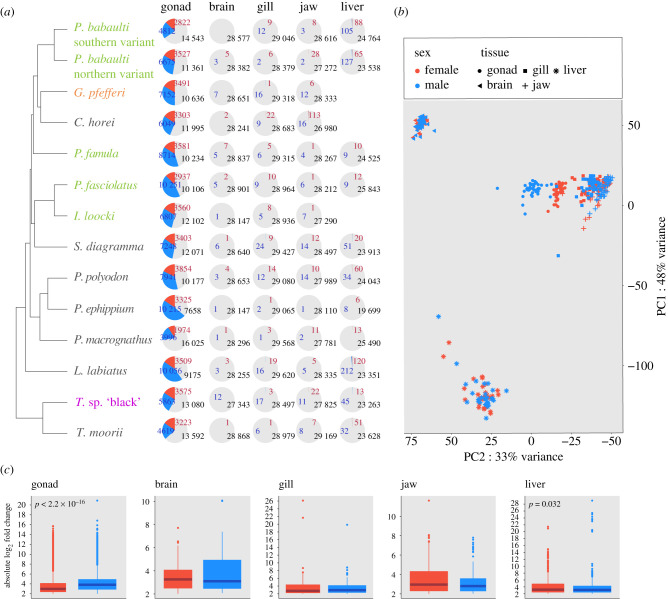
Figure 2.
(a) Proportions of sex-biased genes within each organ and species are indicated with pie charts along the species tree (blue: MBGs; red: FBGs; grey: unbiased genes). Species names are coloured with respect to sex chromosomal systems as depicted in figure 1. For three species (G. pfefferi, C. horei and I. loocki) not enough replicates per sex were available to investigate sex-biased gene expression in the liver. These species were hence excluded. (b) Principal component analysis of gene expression across organs and samples. Samples are coloured according to sex (blue: males; red: females), symbol shapes refer to organ type (see figure inlet). Proportion of variance explained by the first two principal components (PC1 and PC2) is indicated at the plot axes. (c) The plots summarize the absolute change in gene expression for female (red) and male (blue) biased genes across species within each organ. Boxplot centre lines represent the median, box limits the upper and lower quartiles and whiskers the 1.5× interquartile range. Outliers are not shown.

