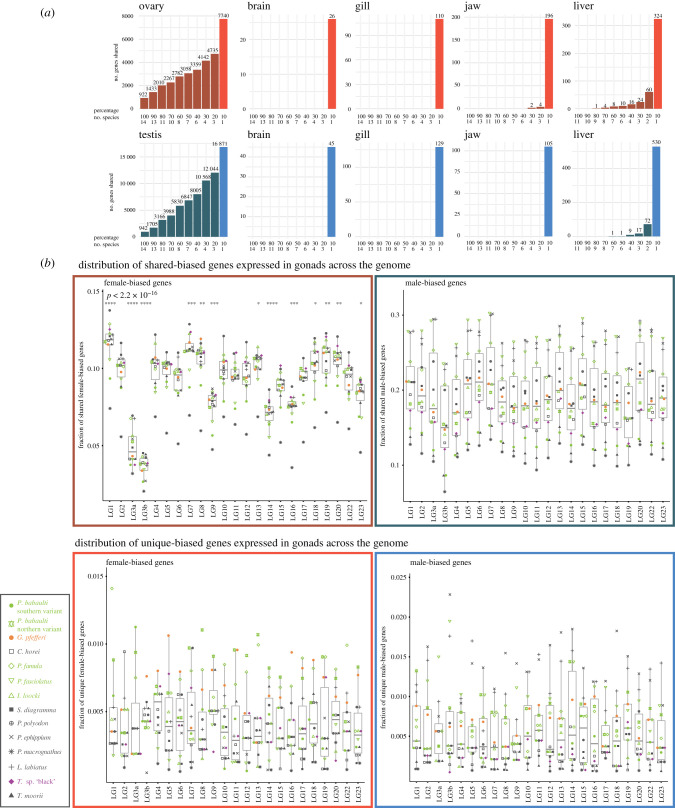
Figure 3.
(a) Barplots indicate the number of unique and shared sex-biased genes across species and organs (red: female-biased; blue: male-biased). Number on bars indicates the number of genes in each category. (b) Upper panel: chromosomal distribution of genes with sex-biased expression in the gonad in at least two species; lower panel: chromosomal distribution of genes with species-specific sex-biased expression in the gonad (red: ovary; blue: testis). Boxplot centre lines represent the median, box limits the upper and lower quartiles and whiskers the 1.5× interquartile range. Per species values are indicated with symbols depicted in the inlet. Symbols indicating statistical significance are *p ≤ 0.05, **p ≤ 0.01, ***p ≤ 0.001, ****p ≤ 0.0001.

