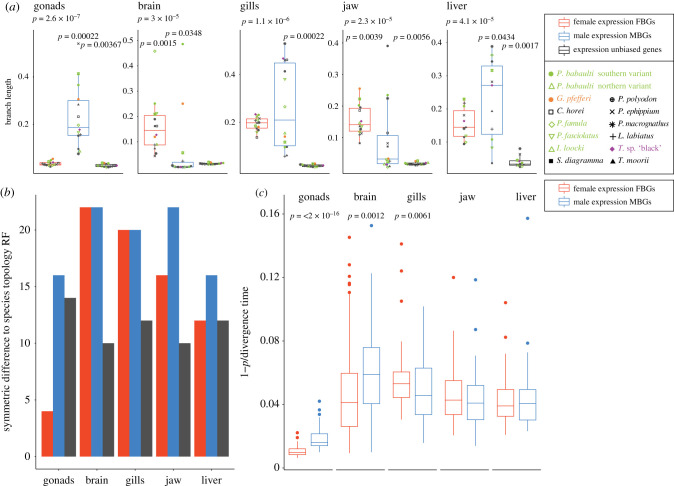
Figure 5.
(a) Boxplots show cumulative branch length from root to tips of expression phylogenies of FBGs in females (red) and MBGs in males (blue) and unbiased genes for each organ. Boxplot centre lines represent the median, box limits the upper and lower quartiles and whiskers the 1.5× interquartile range. Per species values are indicated with symbols depicted in the inlet. (b) Robinson–Foulds (RF) distance of expression phylogenies of each organ to topology of the species tree [11]. (c) Rate of expression changes assessed as [1 – ρ]/divergence time [11] for FBGs and MBGs in each organ.

